Case Study | Smart Technology MVP
SMART BUILDING TECHNOLOGY
Senior Product Design & Interactions
Industry Type: Smart building solutions
Background
A large commercial office building, equipped with advanced smart building technology, is relying on IoT sensors, automated systems, and real-time data analytics to optimize energy use, maintain HVAC systems, and ensure overall building performance. The building also operates a pipeline system that supplies water, gas, and electrical power to various departments. These systems are monitored by a central control platform.
Objective:
To assess the risk of failures in the smart building's infrastructure and monitor the pipeline systems that are critical for energy, water, and power management.
Initial Data Assessment The building’s IoT sensors send real-time data to the central monitoring system, which tracks the performance of various systems such as HVAC, lighting, water supply, and electricity distribution. The pipeline system, responsible for delivering essential utilities to the building, is also continuously monitored for any abnormalities, such as pressure drops or flow disruptions.
Key Risk Areas Identified:
Energy consumption spikes that exceed set thresholds.
HVAC systems experiencing unplanned shutdowns or inefficiencies.
Water pipeline pressure anomalies.
Potential power surges or interruptions in critical areas.
Identifying Potential Failures in the Pipeline An automatic alert system identifies a drop in water pressure within one of the building’s main pipelines. The central control platform cross-references this with historical data and alerts the maintenance team that this is an early warning of a potential leak or blockage in the pipeline. At the same time, the system flags an increase in energy consumption in the building's cooling system, indicating that the HVAC system is working harder than expected.
Risk Factors to Monitor:
Pipeline Blockage or Leak: A drop in water pressure is a clear indicator that the pipeline may be blocked or leaking, which can lead to water shortages or expensive repairs if not addressed.
HVAC Malfunction: Excessive energy consumption by the HVAC system suggests inefficiencies, potentially caused by an airflow issue, faulty components, or the need for system recalibration.
Simulation and Predictive Analytics
To predict future failures, the system runs simulations based on the current data, using machine learning algorithms to model possible outcomes. These simulations predict that if the pressure drop in the pipeline continues without intervention, there is a 60% chance of a complete system failure in the next 48 hours. Additionally, predictive analytics show that if the HVAC system continues to operate at this inefficiency, energy costs could increase by 15% over the next quarter.
Risk Mitigation and Response Based on the risk assessment, the control platform initiates a response plan:
Pipeline Risk Mitigation:
The building management system schedules an inspection of the pipeline to check for leaks or blockages, using drones equipped with sensors to detect potential issues.
Backup water systems are activated to reduce dependency on the affected pipeline, ensuring minimal disruption.
HVAC System Optimization:
The smart system recalibrates the HVAC settings to optimize performance and energy usage.
Maintenance teams are alerted to perform a diagnostic on the HVAC components, including checking airflow and verifying the integrity of the filters and fans.
Continuous Monitoring and Review
The system continuously monitors the building’s infrastructure to track improvements in energy consumption and pipeline performance. Regular risk assessments are conducted to identify any emerging issues, and real-time analytics keep all stakeholders informed about the status of the building systems. Any abnormal data is flagged immediately, allowing for proactive maintenance and adjustments.
Outcome:
The early detection of pipeline issues and HVAC inefficiencies prevents costly failures and downtime. Through continuous monitoring, predictive analytics, and rapid response, the building can operate more efficiently, reduce operational costs, and ensure a sustainable, safe, and reliable environment for its occupants.
Website: Concept Prototype
Design, Wireframing and Prototyping
Figma
User Studies, interviews and testing.
Stakeholder interviews
Discovery workshops and listening sessions
One-on-one interviews
Graphs, charts and data: Excel
Graphic: Generative AI image creation
Key features
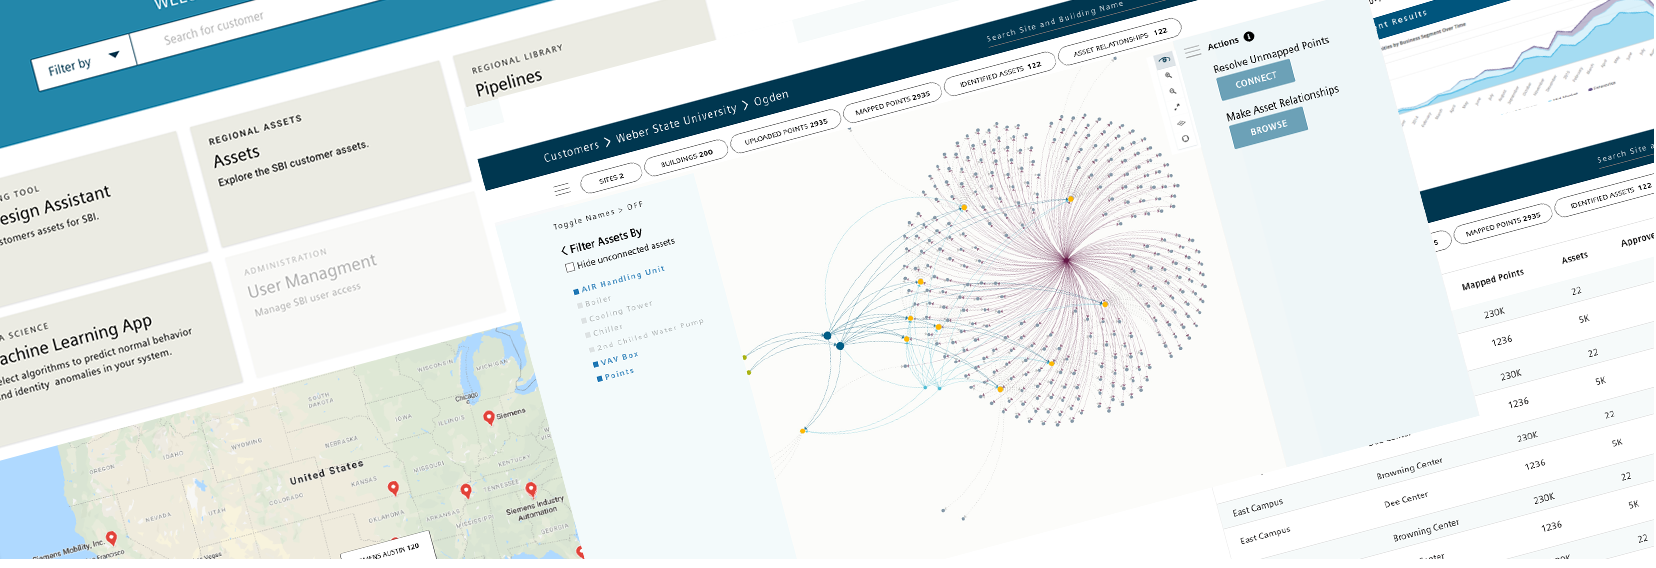
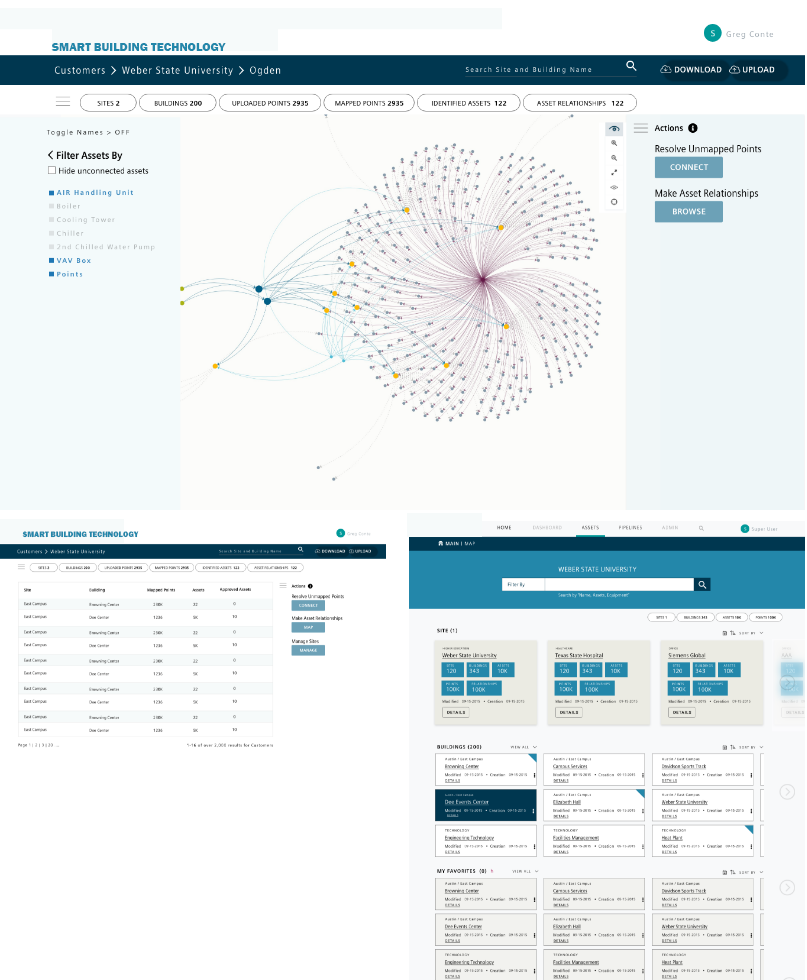
Here is a visualization of a leading trend in smart building automation, focusing on the integration of IoT-enabled energy management, predictive maintenance, and real-time monitoring. It shows how smart building systems are interconnected for optimal efficiency and performance.
A key HVAC risk assessment dashboard should provide critical data and insights to help monitor and mitigate risks related to HVAC systems. Some of the essential features include:
Real-Time Monitoring:
Displays live data on HVAC performance, including temperature, humidity, airflow, and energy consumption.
Monitors system components like compressors, fans, and filters to track their operational status.
Alert & Notification System:
Sends instant alerts for anomalies or deviations from set performance thresholds (e.g., pressure drops, temperature spikes, system shutdowns).
Configurable alerts for various risk levels (e.g., low, medium, high).
Predictive Analytics:
Uses historical data and machine learning to predict potential failures, such as component wear or system inefficiencies.
Provides insights into future risks based on patterns of system behavior and environmental conditions.
Energy Efficiency Insights:
Highlights areas of inefficiency, helping to identify energy-intensive processes or equipment.
Displays energy consumption patterns and compares them against set benchmarks, suggesting optimizations for reducing costs.
Maintenance Scheduling:
Tracks maintenance history and upcoming service needs.
Automatically schedules preventive maintenance based on usage patterns or system performance trends, helping to minimize downtime.
System Health Dashboard:
Provides an overview of system health with key metrics such as temperature ranges, pressure levels, and air quality.
Visual representations (graphs, gauges, and heatmaps) show real-time system performance against ideal parameters.
Risk Scoring & Prioritization:
Assesses risks using a scoring system to prioritize areas requiring attention based on severity (e.g., high risk of failure vs. minor inefficiencies).
Identifies the most critical HVAC components that may affect overall system performance or cause operational disruption.
Compliance Tracking:
Ensures HVAC systems are compliant with safety regulations, local codes, and energy-saving standards.
Tracks and documents compliance inspections and certifications, and issues reminders for necessary renewals.
Historical Data & Trend Analysis:
Provides a historical view of HVAC performance, helping to identify recurring issues or patterns.
Allows for detailed trend analysis of past performance and identifies when certain issues are likely to reoccur.
User-Defined Customization:
Lets users define risk tolerance levels, set personalized alerts, and customize dashboard views to prioritize specific systems or areas of concern.

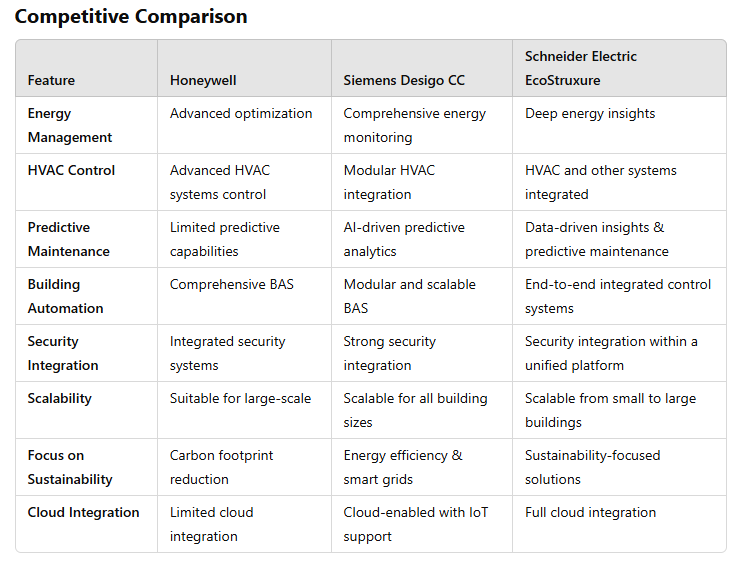
Here’s a competitive analysis of the top three smart building automation systems, focusing on their features, strengths, and areas of differentiation:
Honeywell is a strong player for buildings that require comprehensive solutions across energy, HVAC, and security, especially in large-scale commercial projects.
Siemens Desigo CC offers excellent scalability and integration flexibility with its modular approach and AI-driven analytics, making it ideal for projects requiring a high degree of customization and predictive maintenance.
Schneider Electric EcoStruxure stands out with its focus on sustainability and energy efficiency, combined with its open connectivity and cloud capabilities, making it an excellent choice for buildings seeking smart, green solutions..