HUMAN CENTERED DESIGN IS A HUMAN EXPERIENCE FIRST
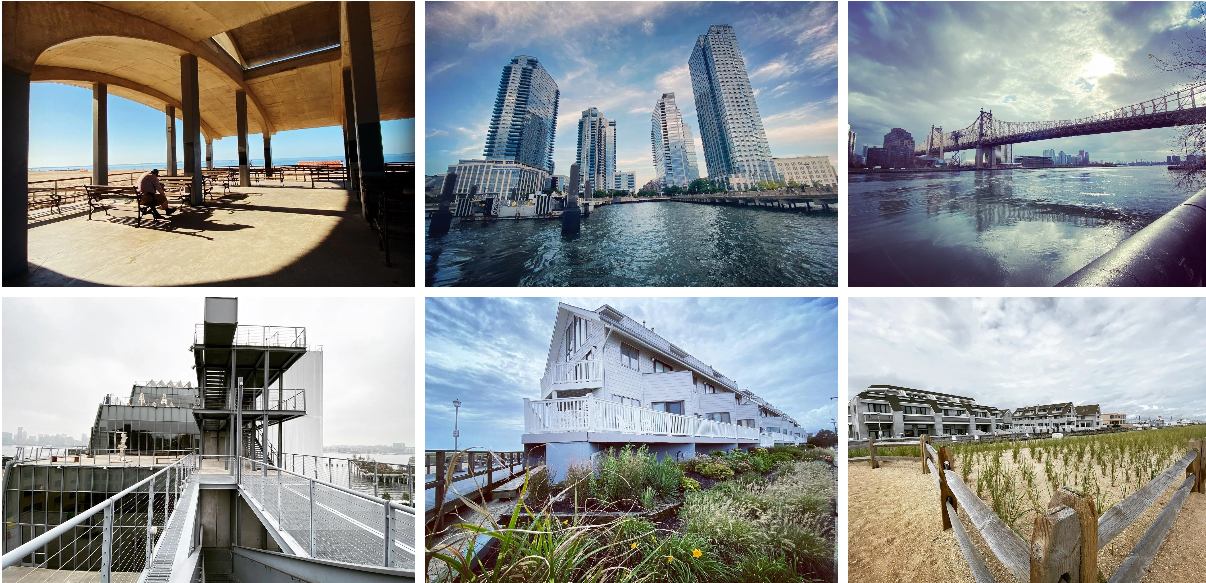
I am a New York–based product designer, with a creative foundation rooted in technological innovation, art and design. A graduate of the School of Visual Arts, I later moved to Austin, Texas, where I led the design of enterprise applications while exploring parallel passions in photography, travel, sailing, and swimming—bringing a multidisciplinary lens to my work with empathy and compassion.
Service and Product Strategy + Research + Design.
End-to-end product thinking from discovery to delivery
Clear UX narratives that align business goals with user needs
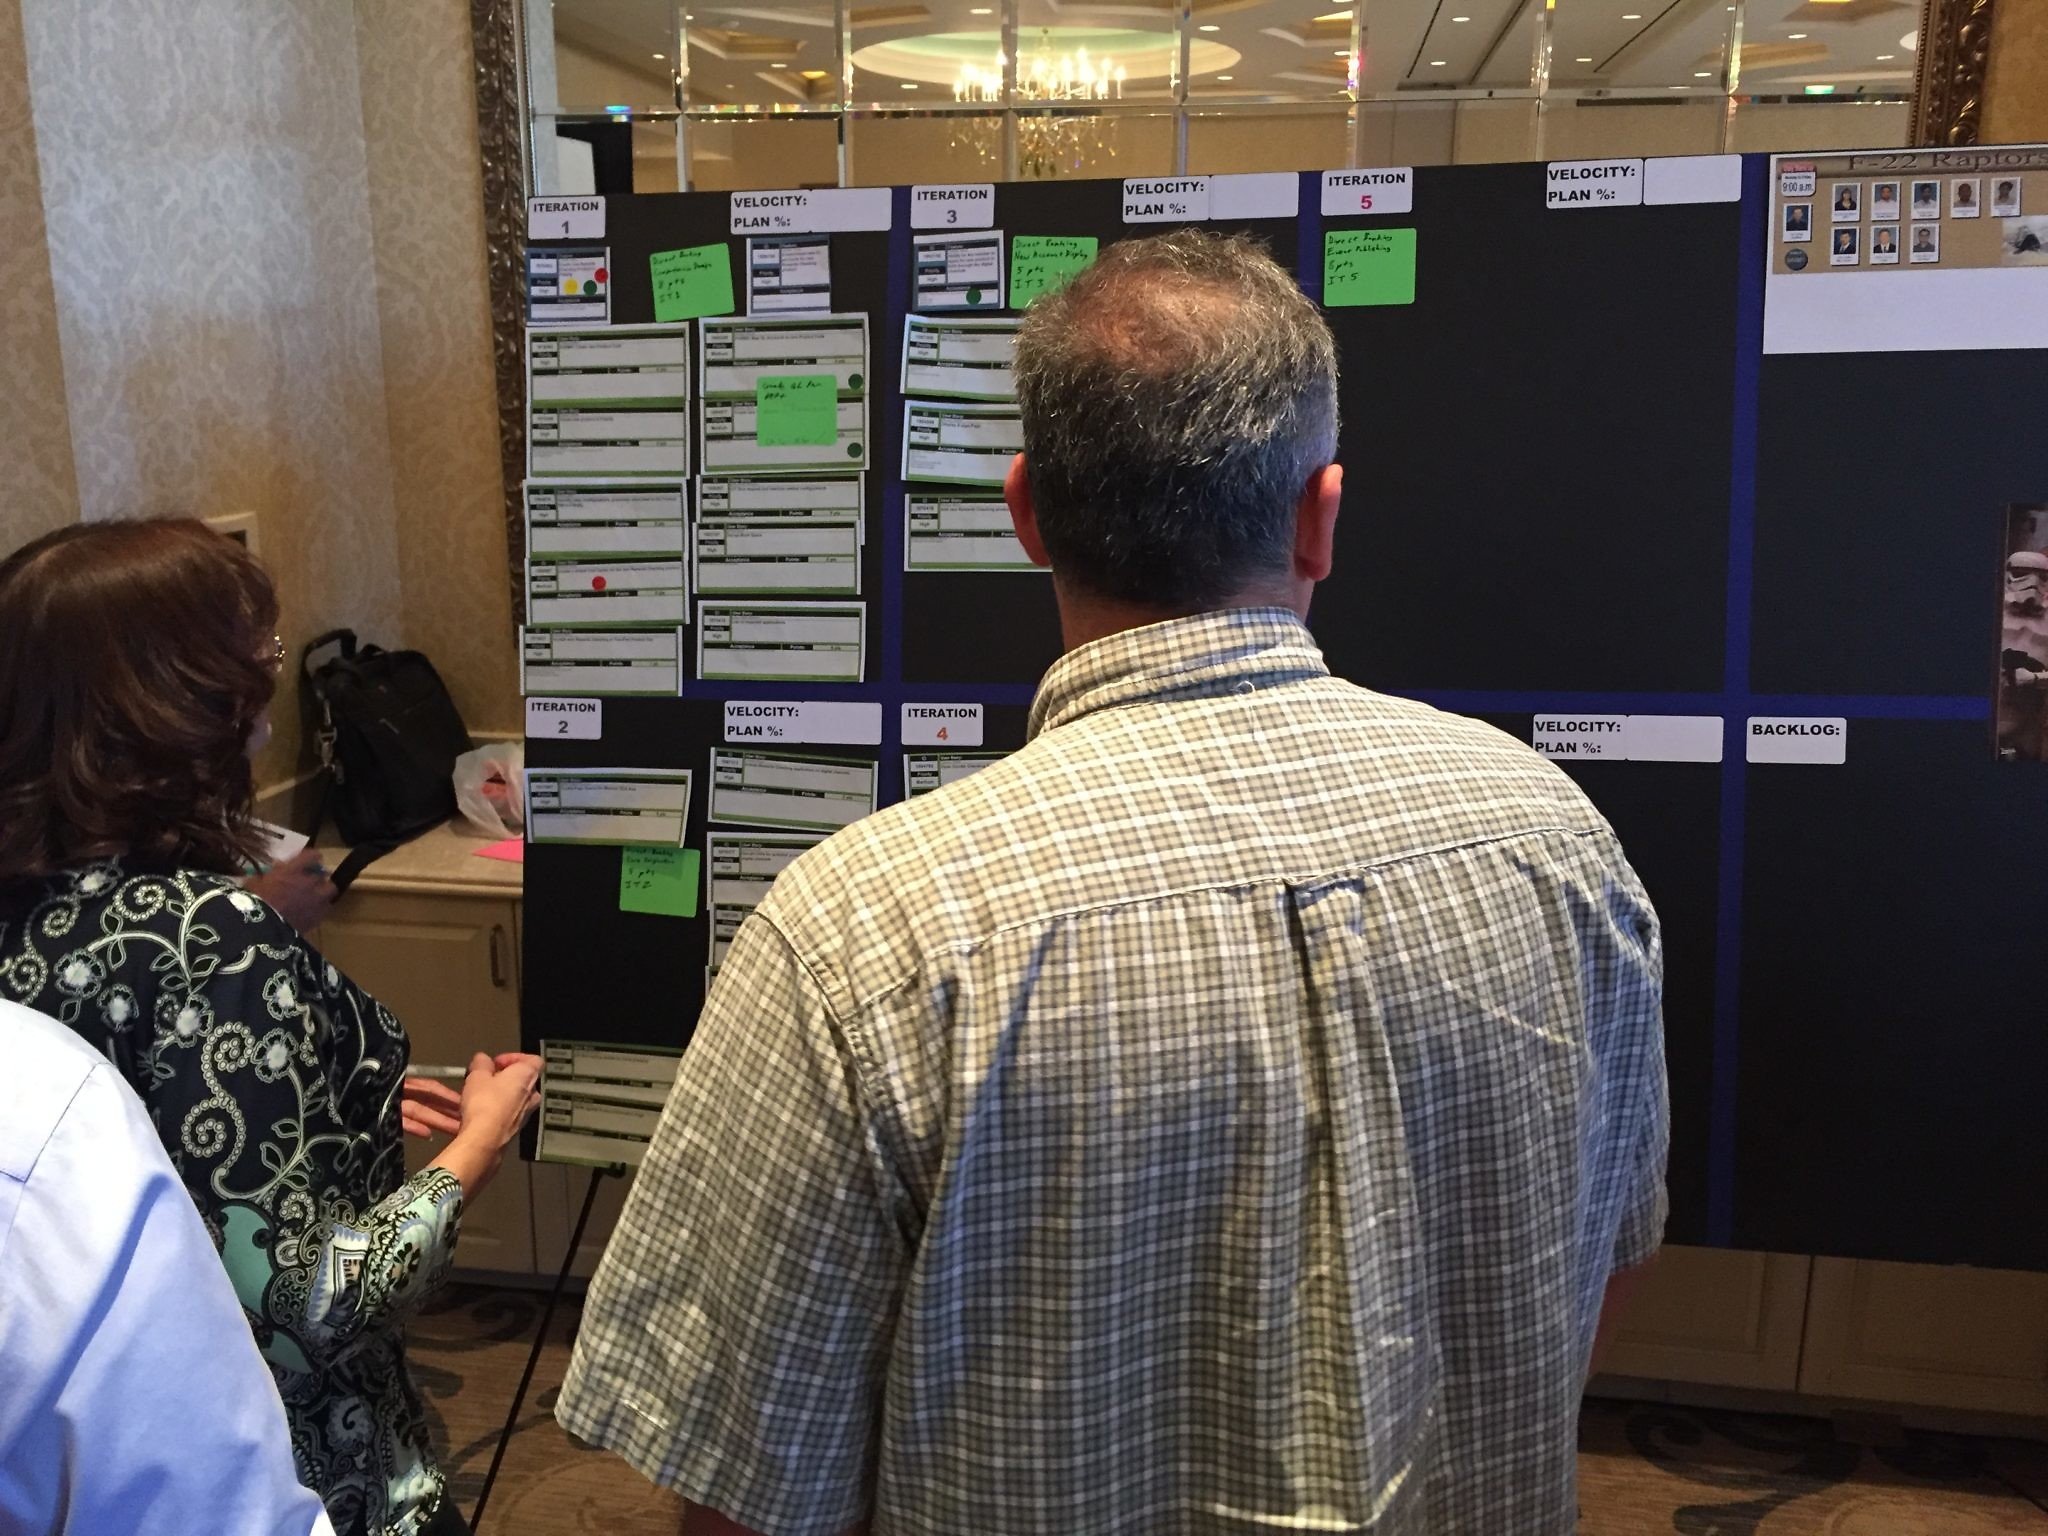
Cross-functional collaboration with Product, Engineering, and Stakeholders
Proactive support for your product development
Creative ideas grounded in user centered behavior and insights
Professional UX and visual design execution in Figma
Scalable design systems and reusable component frameworks
Rapid prototyping and iterative testing to reduce risk and validate concepts
Data-informed decision making through qualitative and quantitative research
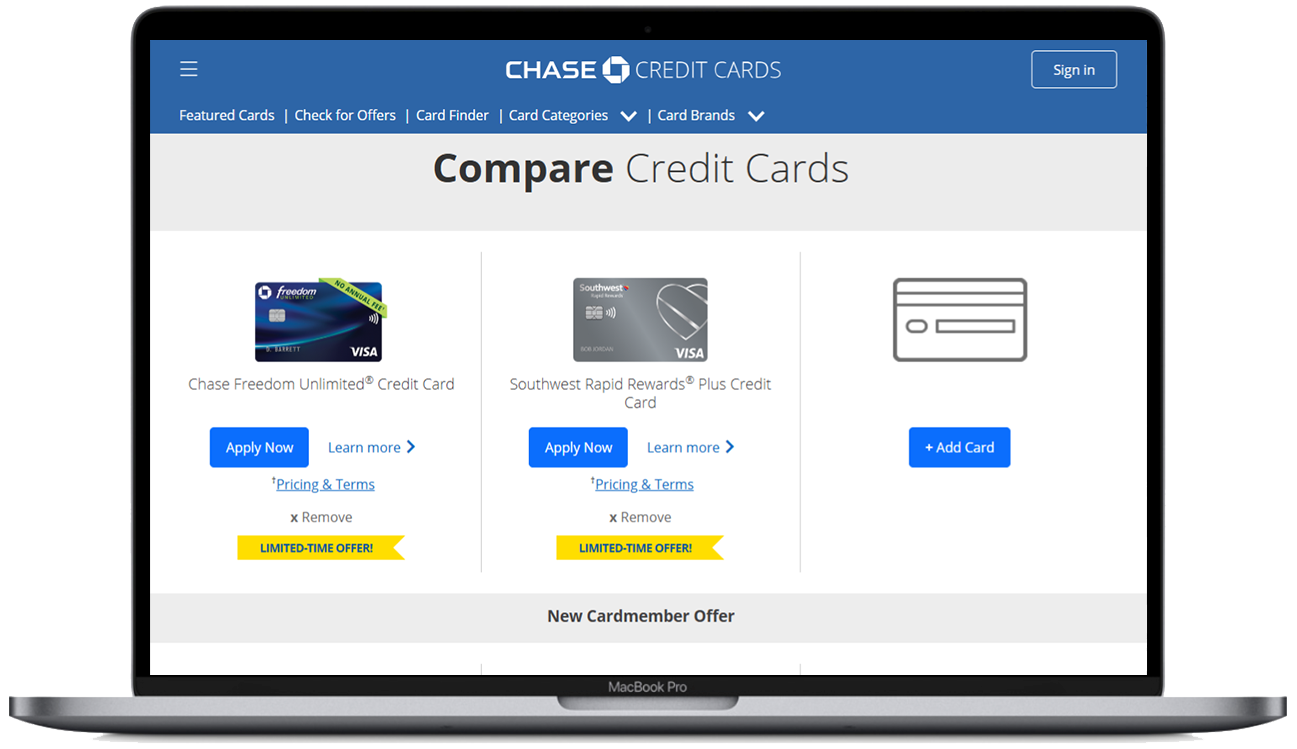
FinTech
• Chase
• USAA
• Q2eBanking
• OnePay
• Lincoln Financial
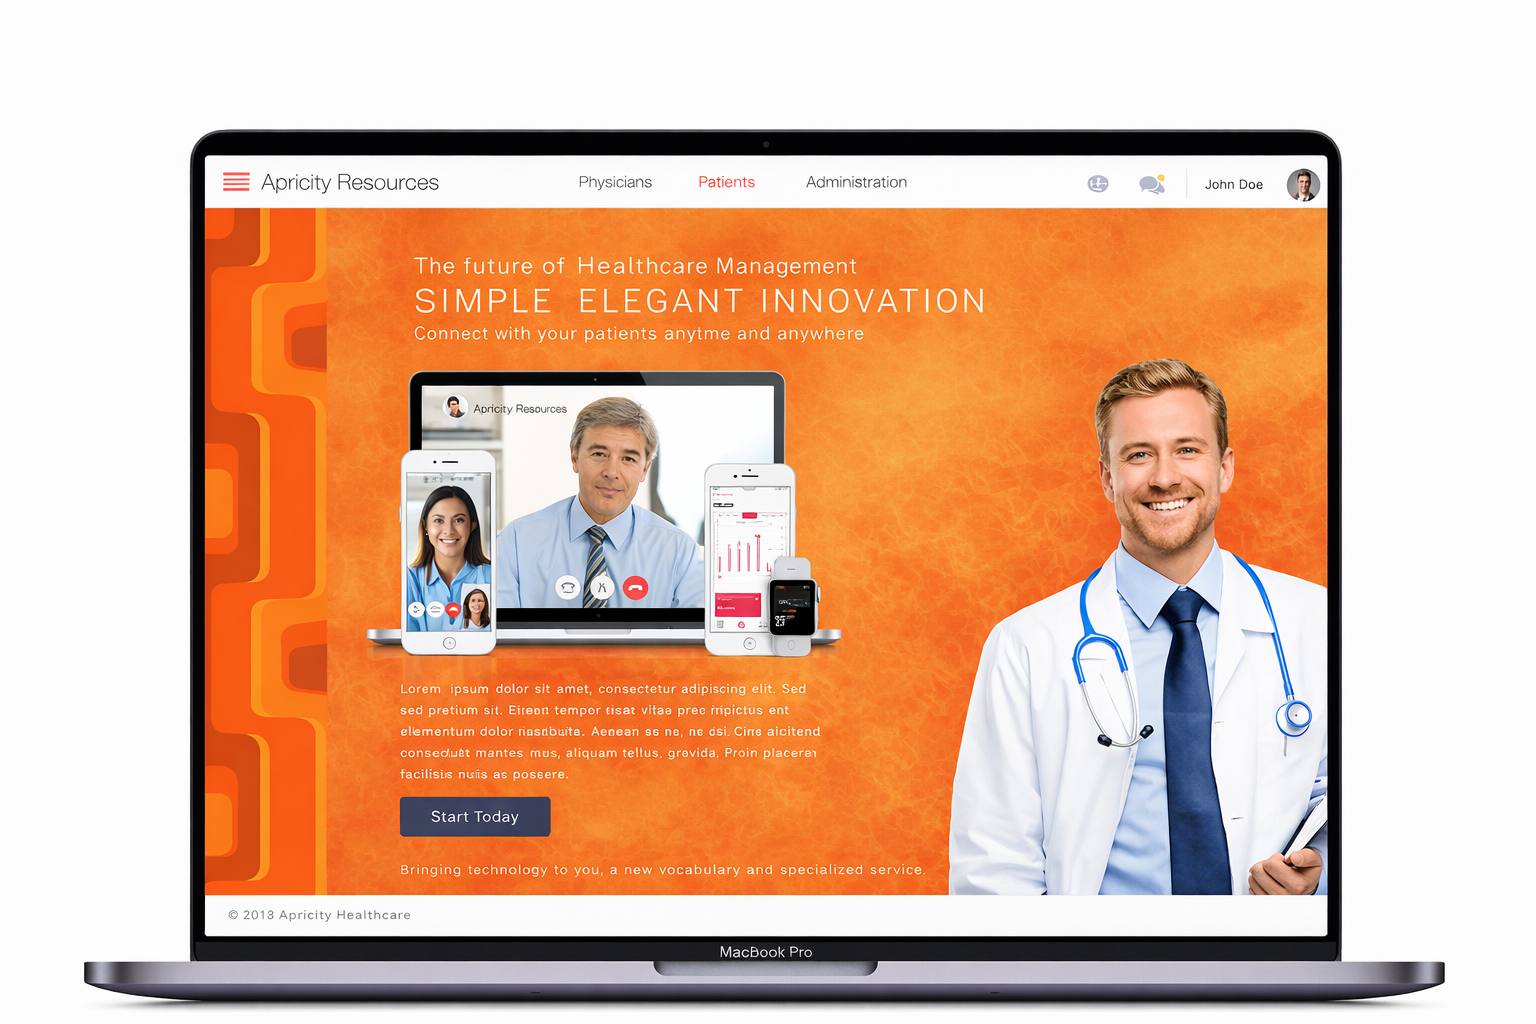
BioTech/Pharma
• Boehringer Ingelheim
• Catalent
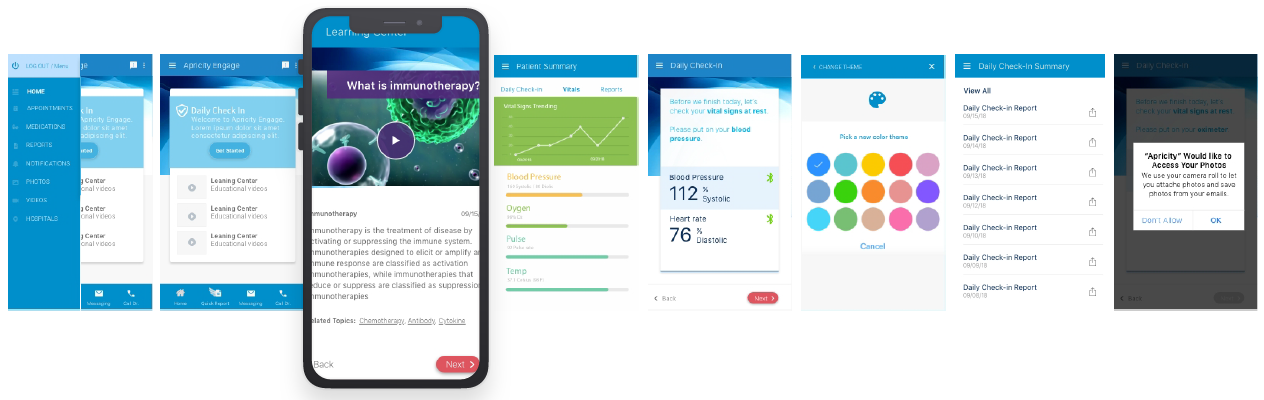
• Apricity Health
Computer Technologies
• Apple
• Dell
• Siemens
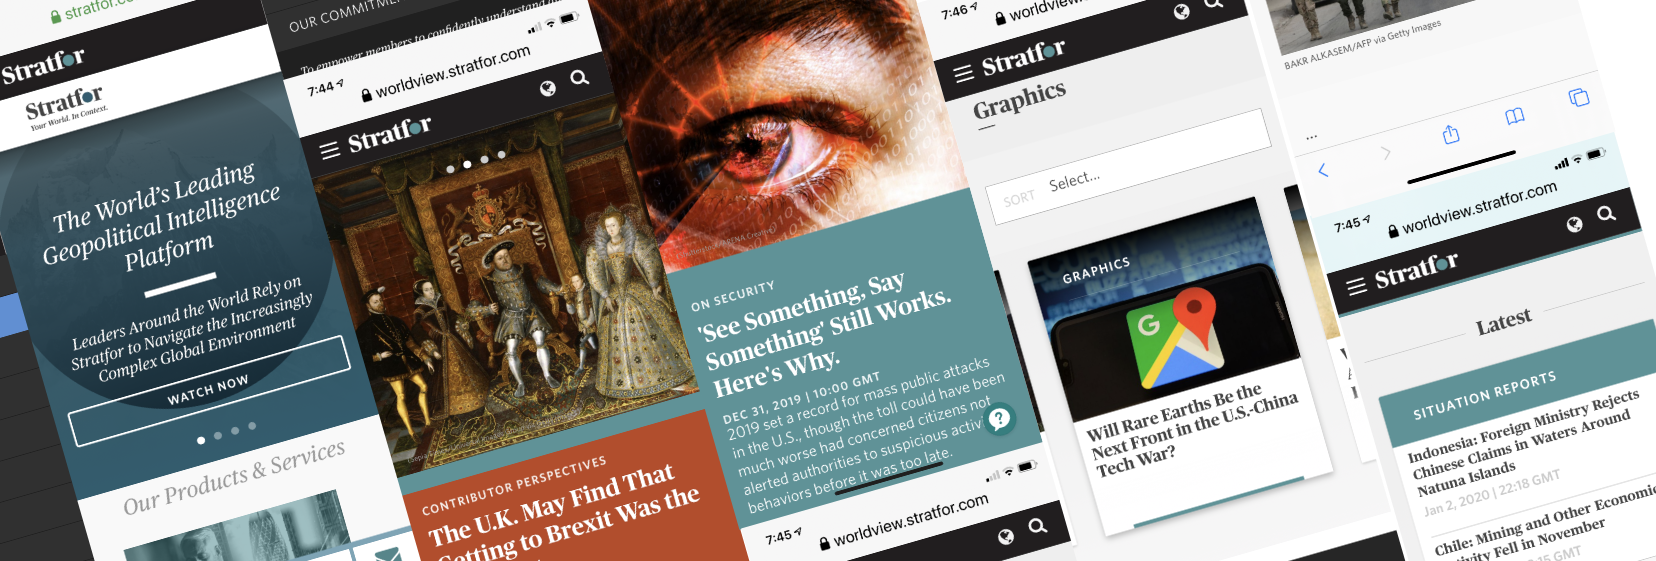
Business Information
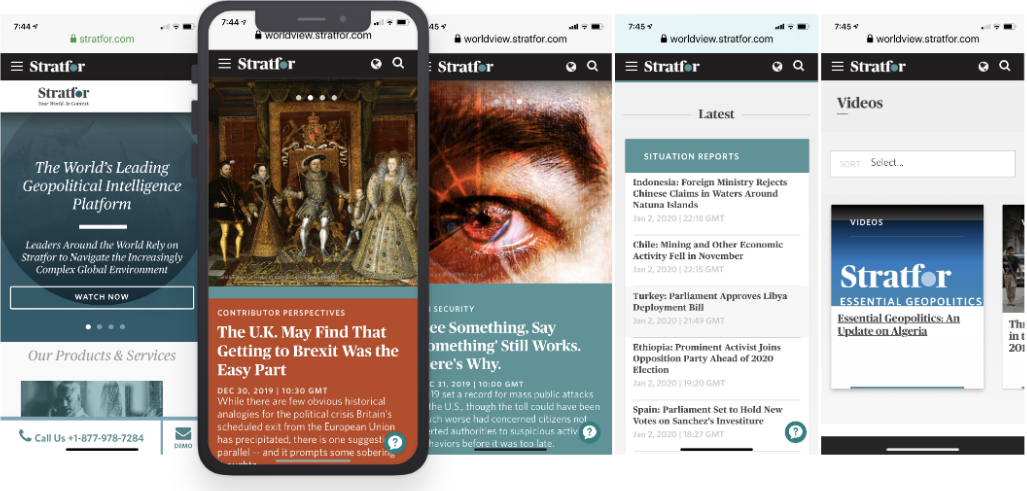
• Stratfor
• Bloomberg BNA
My Wheelhouse
Where Service & Product Design Systems Intersect
“Many designers focus on either the interface or the system—I work across both, ensuring the product experience is grounded in how the service actually functions.”


Enterprise & Global Design Strategy
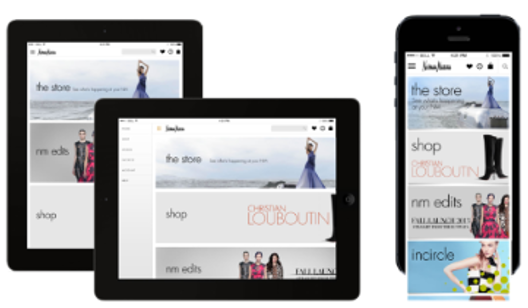
This portfolio showcases a selection of projects highlighting expertise in product design, user research, machine learning, and human-centered design.
Product design consultant delivering human-centered, data-driven solutions that simplify complex systems. Achieved +10% conversion lift, +25% engagement growth, and NPS gains of +8–12 points. Leads end-to-end UX from MVP to launch, increasing adoption by 20–40%, improving task completion by 15–30%, and boosting feature adoption by 30%+.


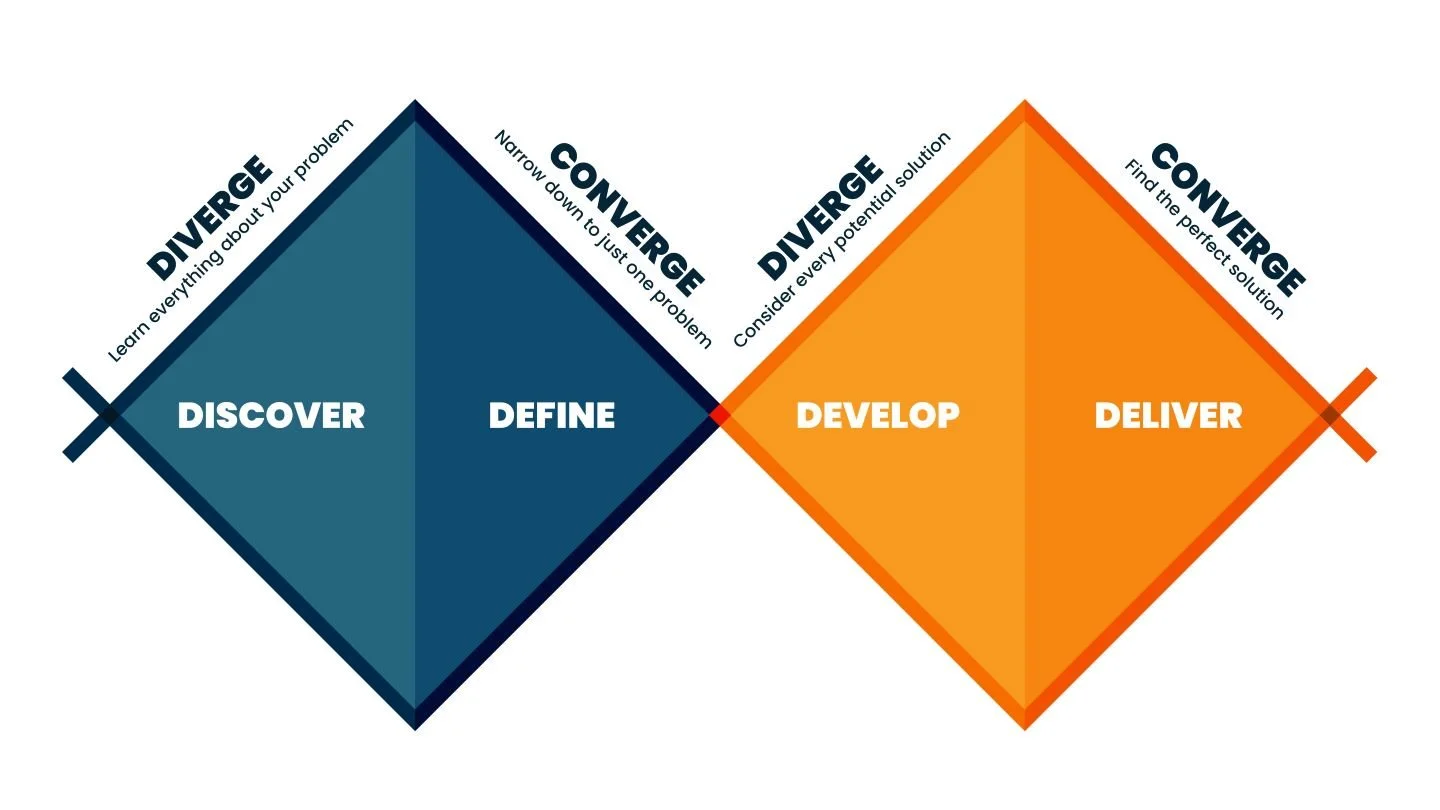
Discover (Diverge)
User interviews
Field research
Data collection
Behavioral insights
Define (Converge)
Synthesis
Affinity mapping
Problem statements
Opportunity areas
Develop (Diverge)
Ideation
Concept generation
Rapid prototyping
Design exploration
Deliver (Converge)
Usability testing
Validation
Iteration
Launch-ready solution
Design Thinking

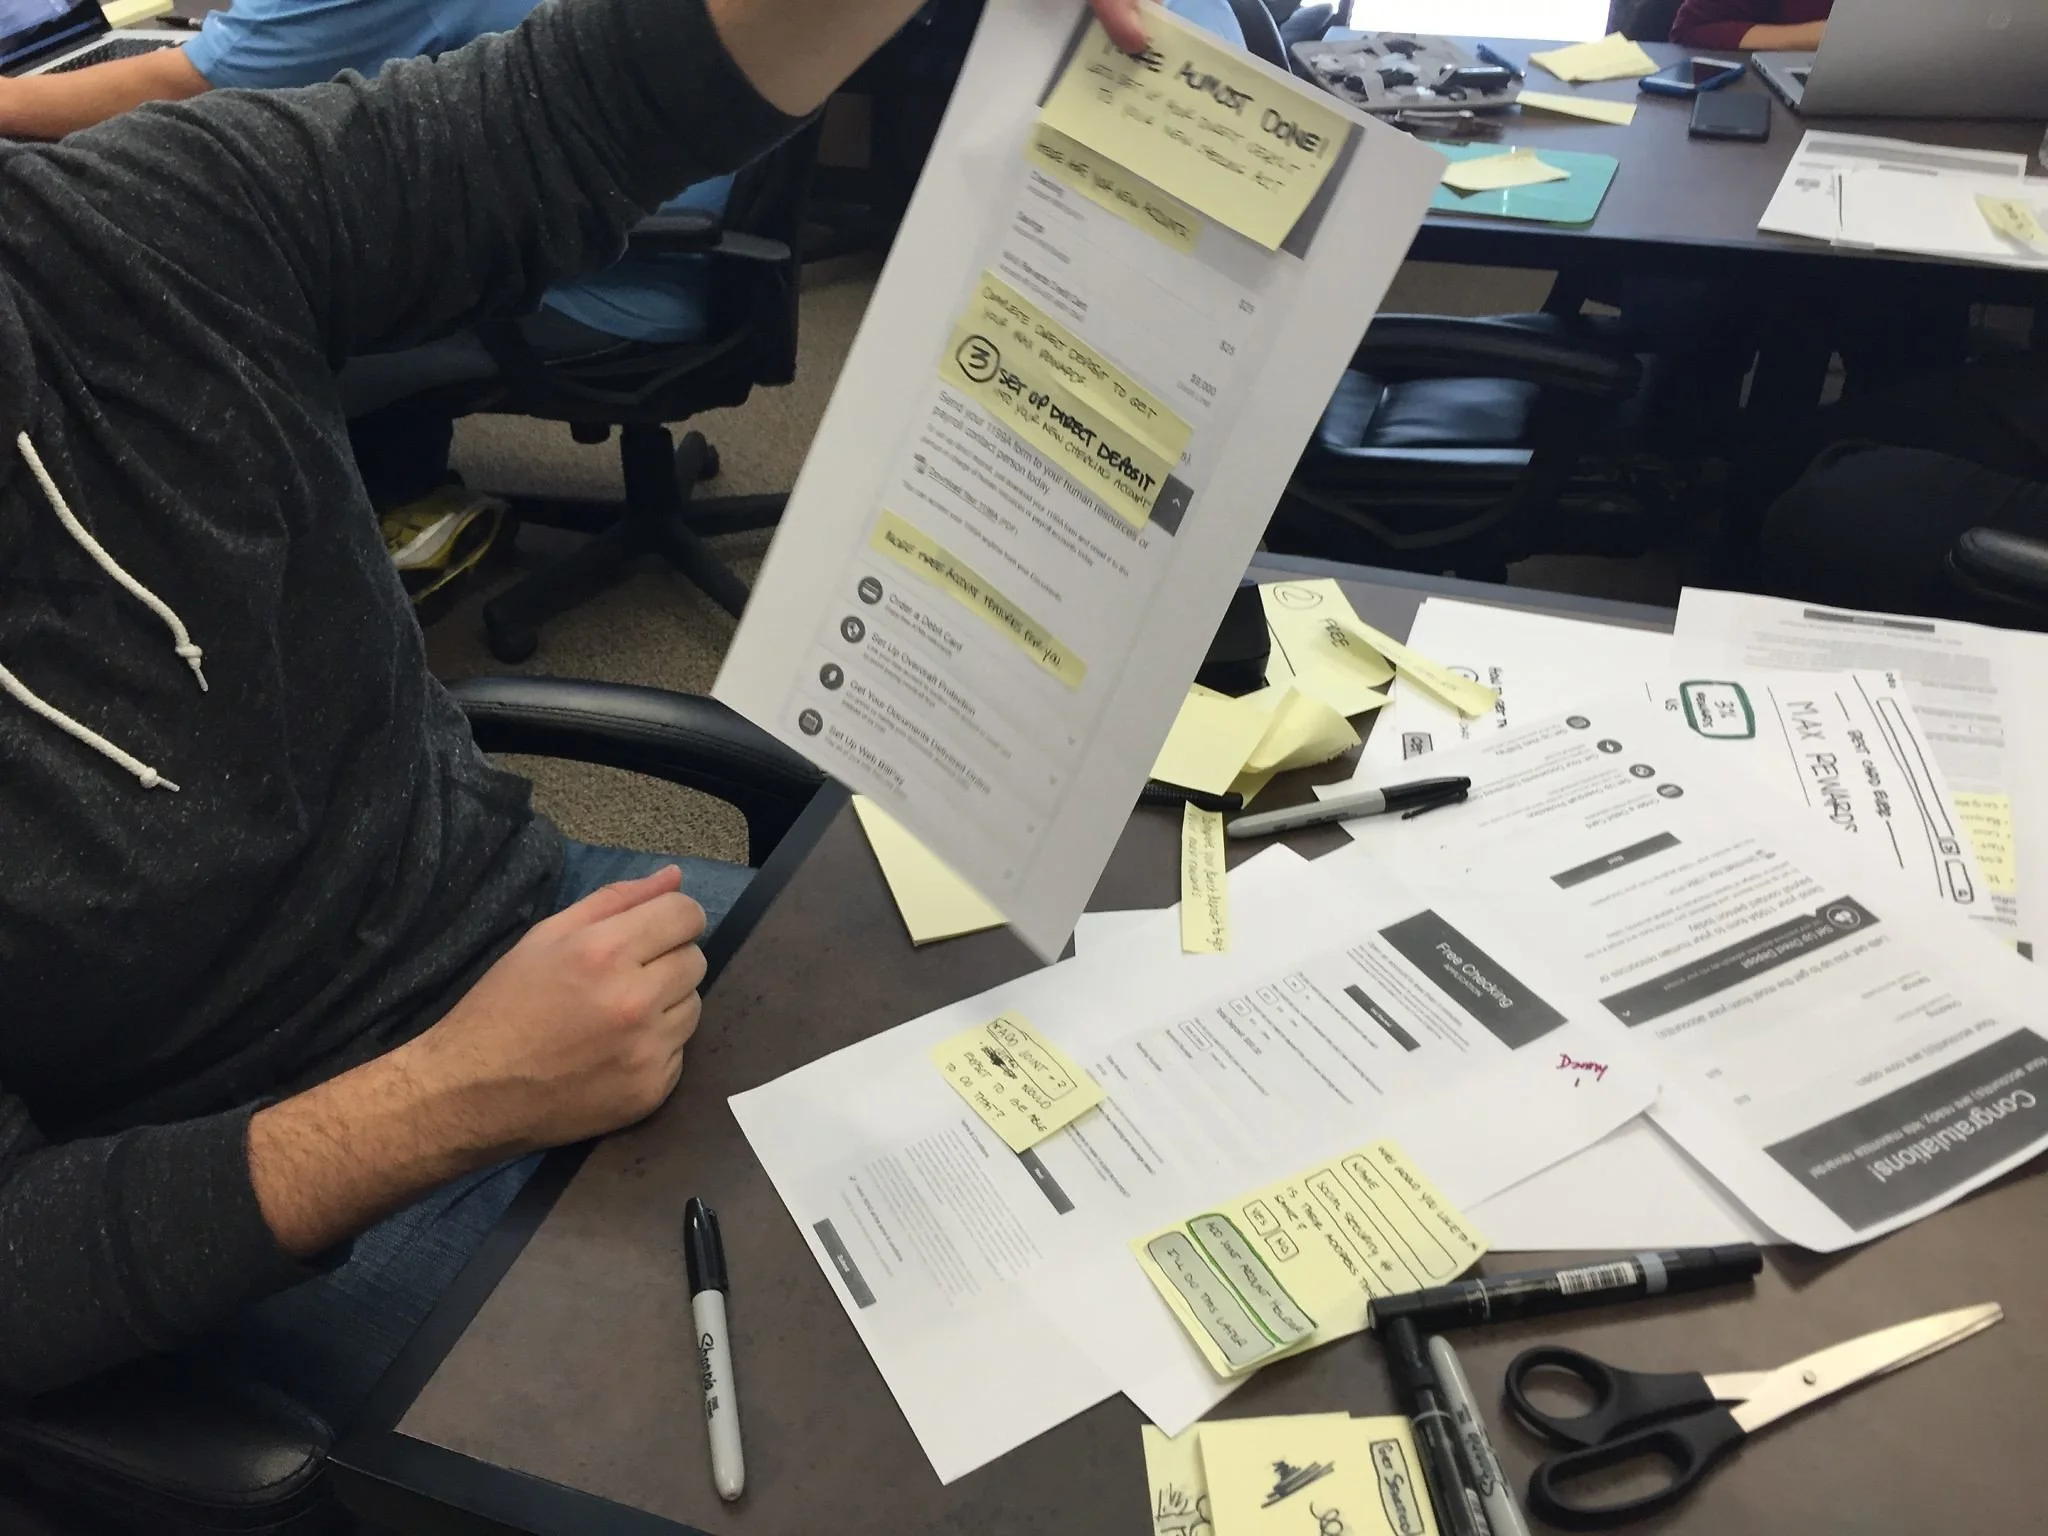
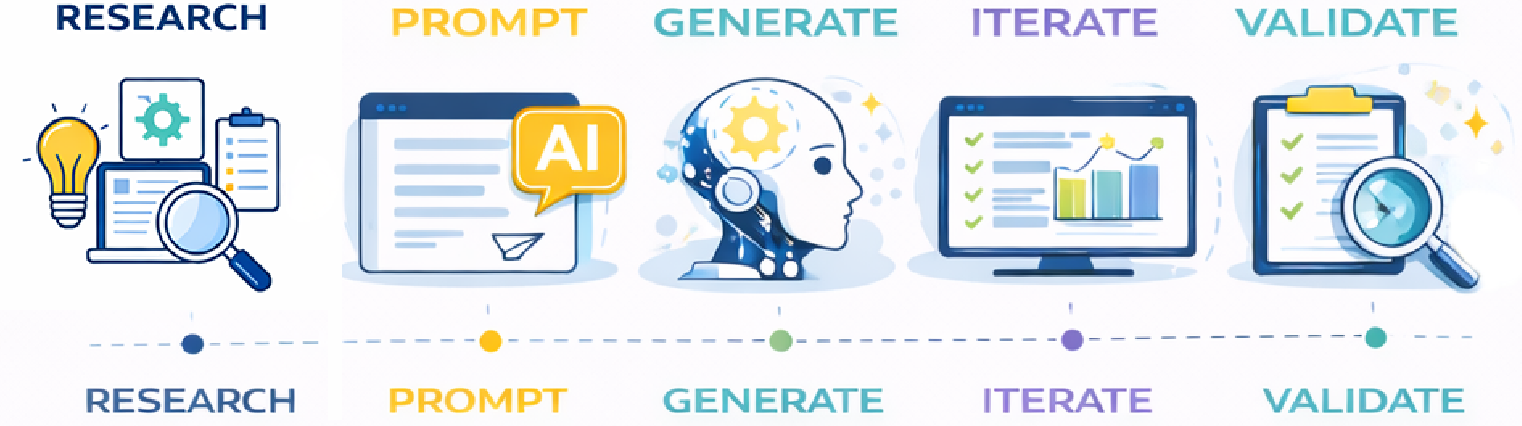
Design thinking grounds my work in user needs, business goals, and technical feasibility. I use an iterative, research-driven approach to reframe problems, generate insights, and rapidly prototype—now accelerated through generative AI to compress discovery, ideation, and validation cycles.
Research
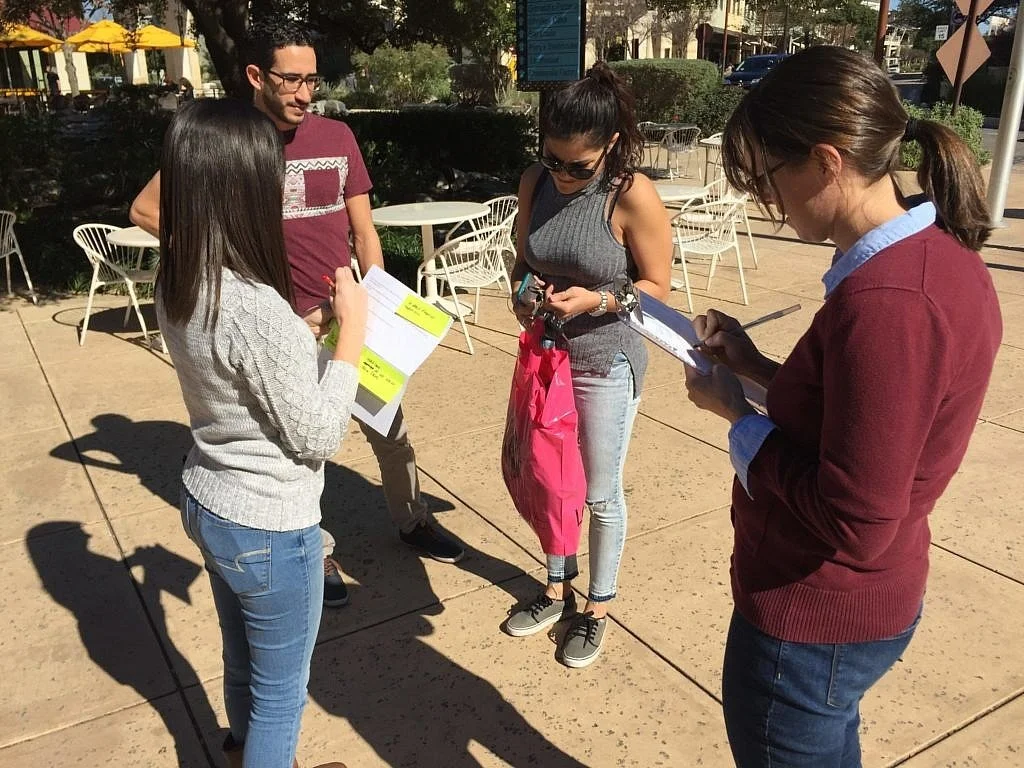
Lead end-to-end UX research—from framing problems and selecting methods to synthesizing insights and validating solutions. My process combines generative and evaluative research to uncover user needs, inform design decisions, and continuously iterate toward measurable outcomes.
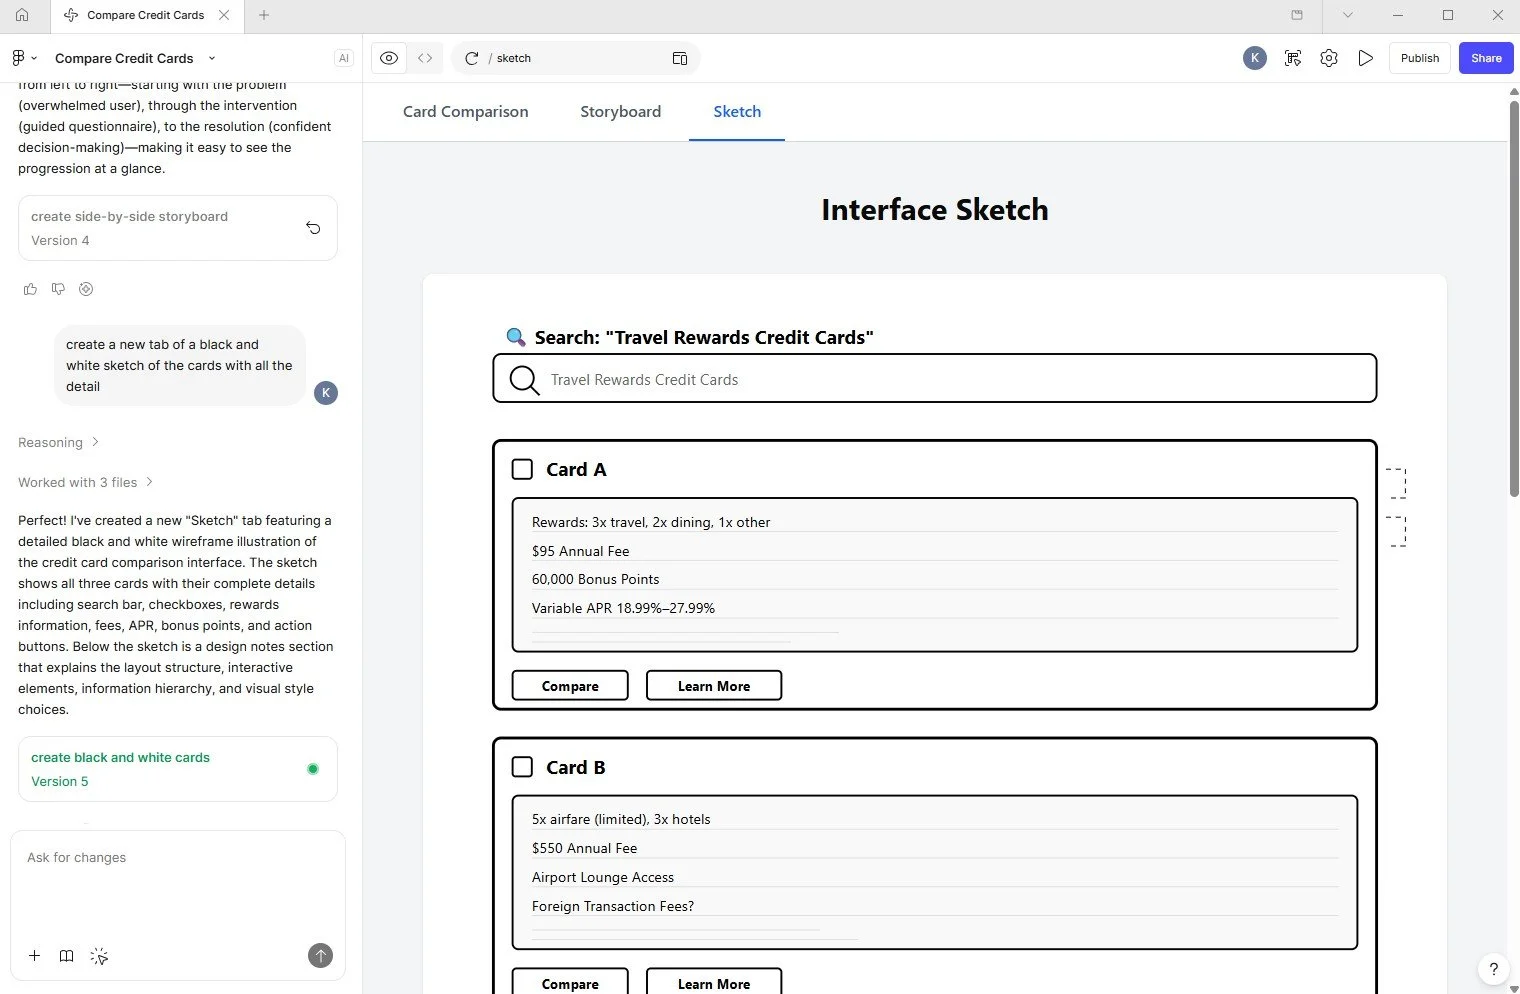
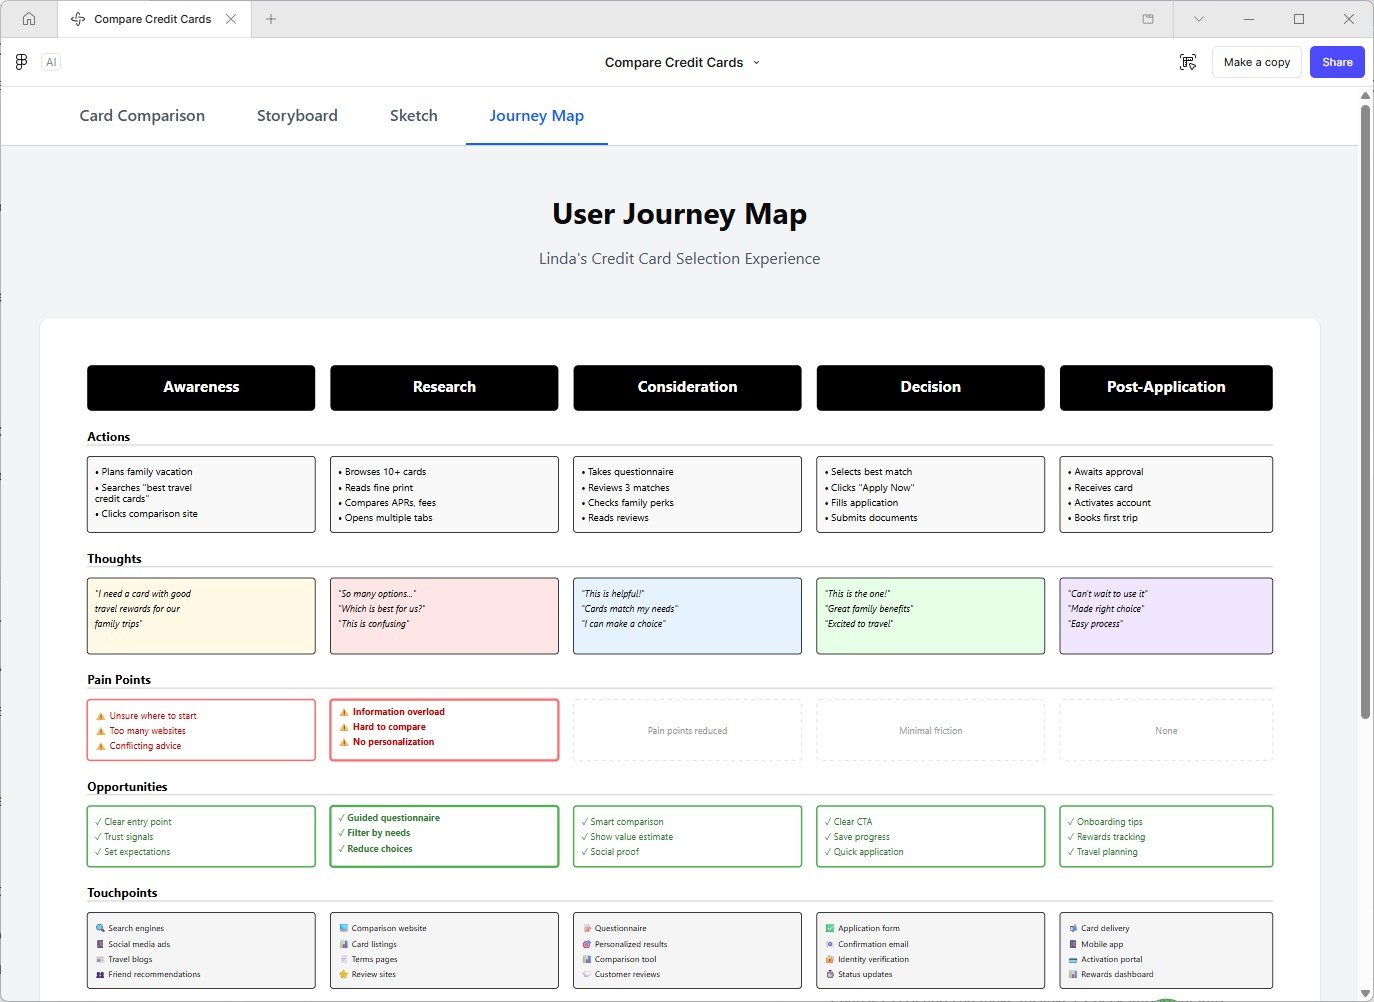
Generative & Vibe Coding Experiments
Exploring how AI transforms design from static artifacts into dynamic, code-driven systems—bridging research, design, and development in real time.
Generative Design & Prototyping
Figma (Figma Make, AI-assisted layouts, system generation)
Framer (live, production-ready prototypes)
AI-Assisted Development (Vibe Coding)
Claude (logic, reasoning, structured outputs)
Rapid Product Builders
Lovable
Base44