< Back Case Study | FinTech
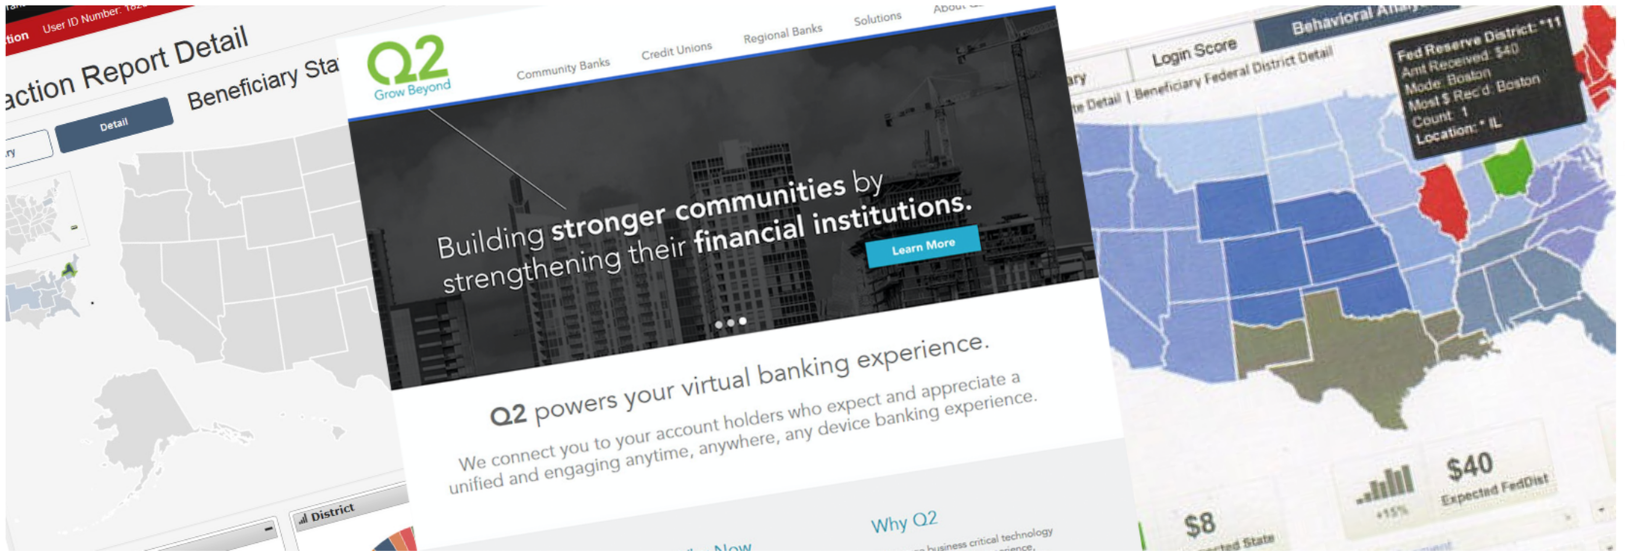
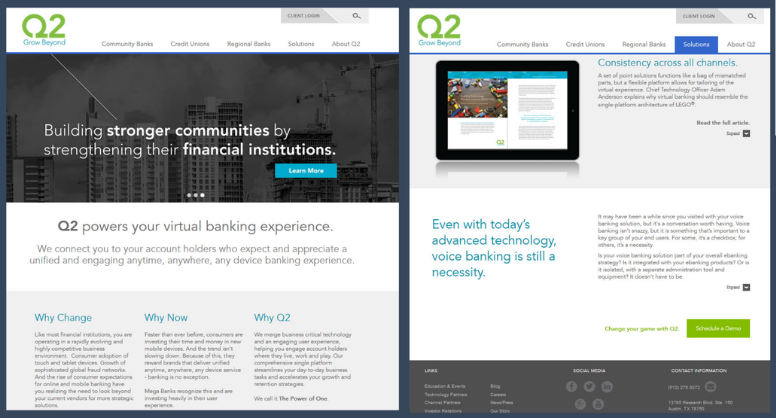
Q2 Digital Banking Platform
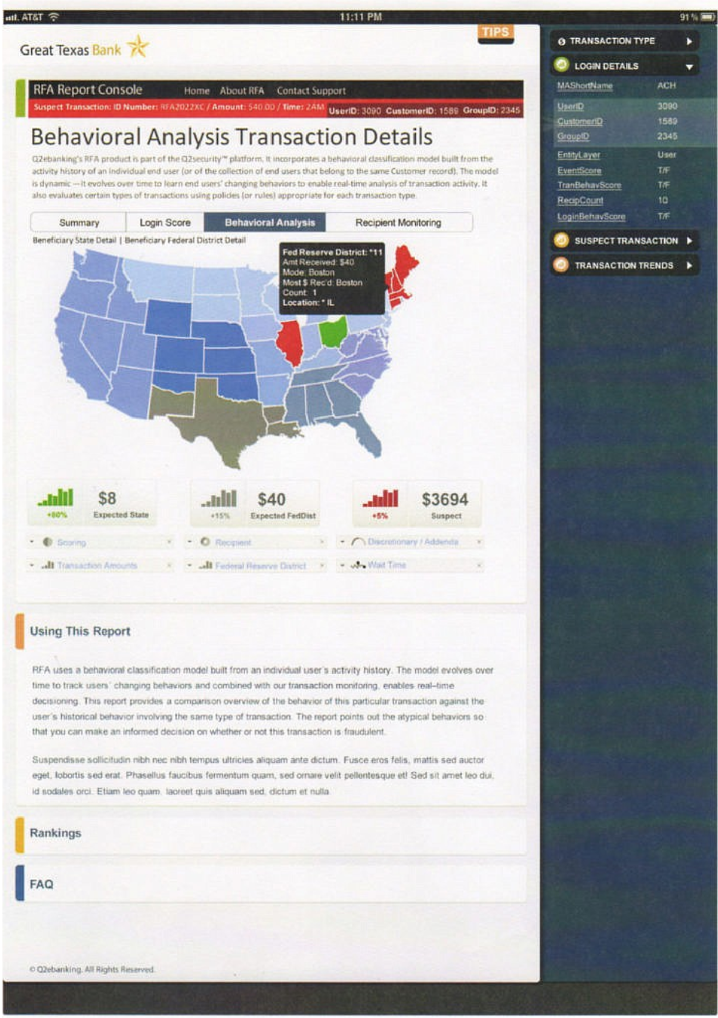
Risk Assessment Dashboard for ACH Transactions
Client: Q2 Holdings
Industry: FinTech / Digital Banking
Platform: Web / iPad / Mobile
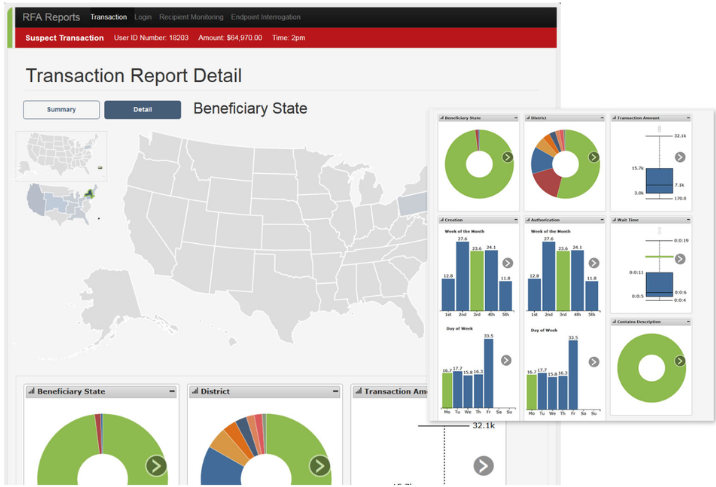
Scope: Enterprise dashboard for monitoring ACH transactions across business and personal accounts
Focus: Risk assessment, trending, historical data & personalization
Role: Senior Product Designer (UX + Research)
Scope: MVP Concept to creation → End-to-end (Discovery → Redesign)
Tools: Adobe XD, D3, UserTesting
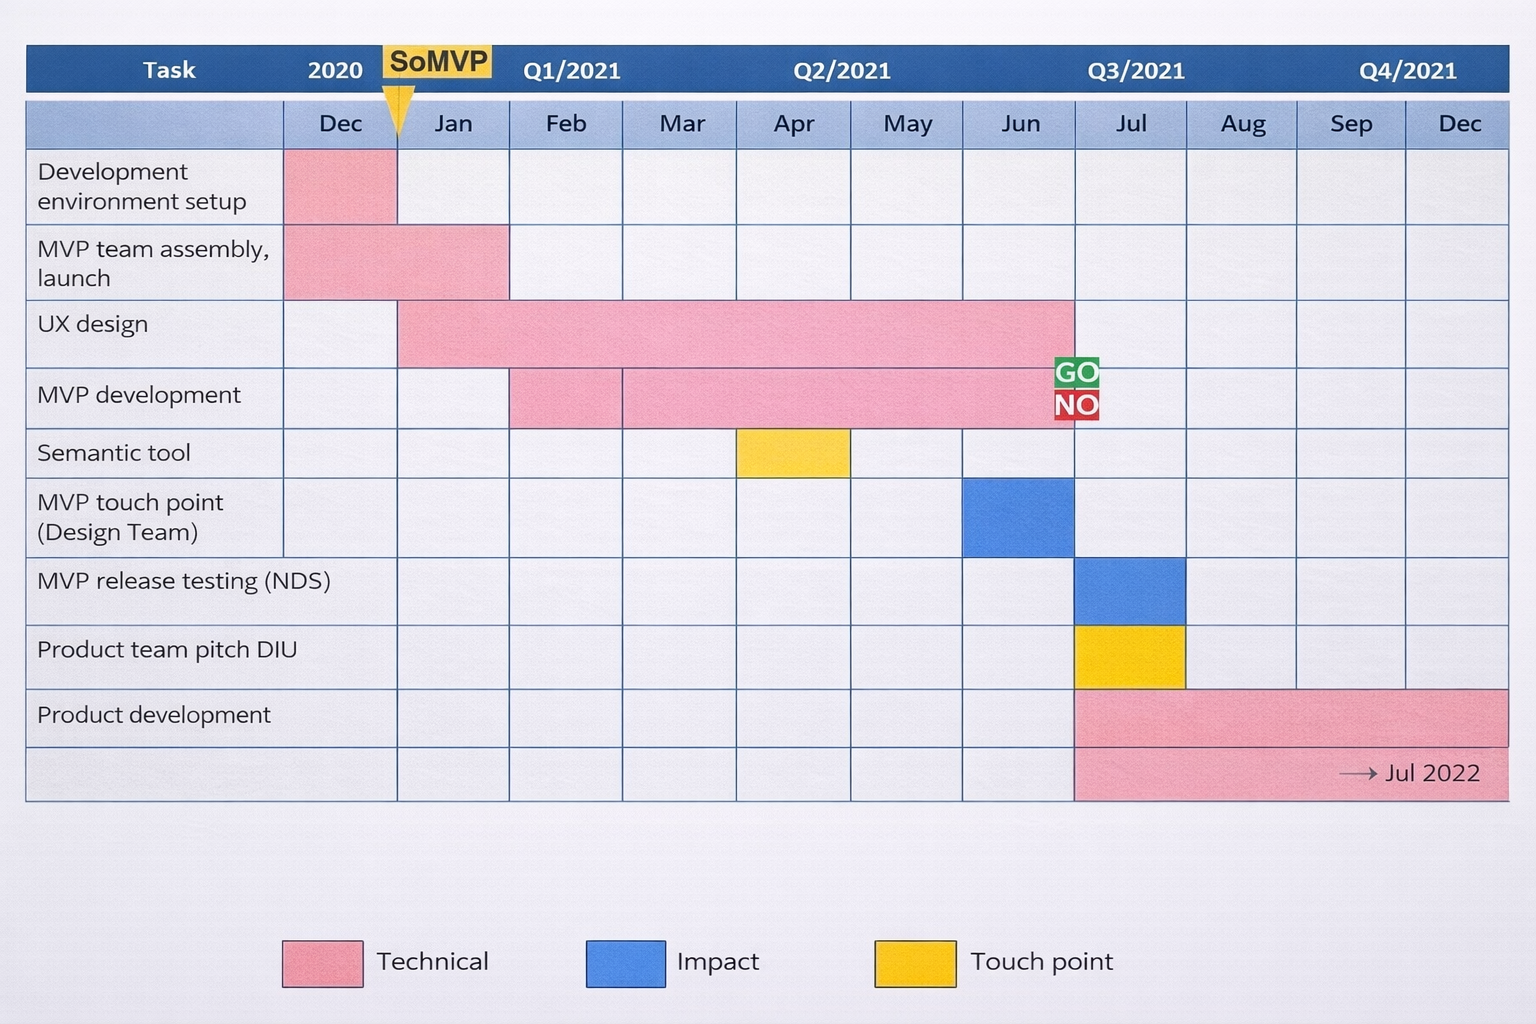
Timeline: 1 year
Q2 provides cloud-based banking infrastructure enabling financial institutions to manage deposits, lending, payments, and fraud detection. As transaction volumes increased, internal teams lacked a scalable, unified system to monitor and assess ACH risk in real time.
My Role
Lead Product Designer (End-to-End UX)
Led discovery → design → validation → delivery
Owned information architecture, UX strategy, and UI design
Collaborated with product, engineering, and QA teams
Facilitated research synthesis and design workshops
Users:
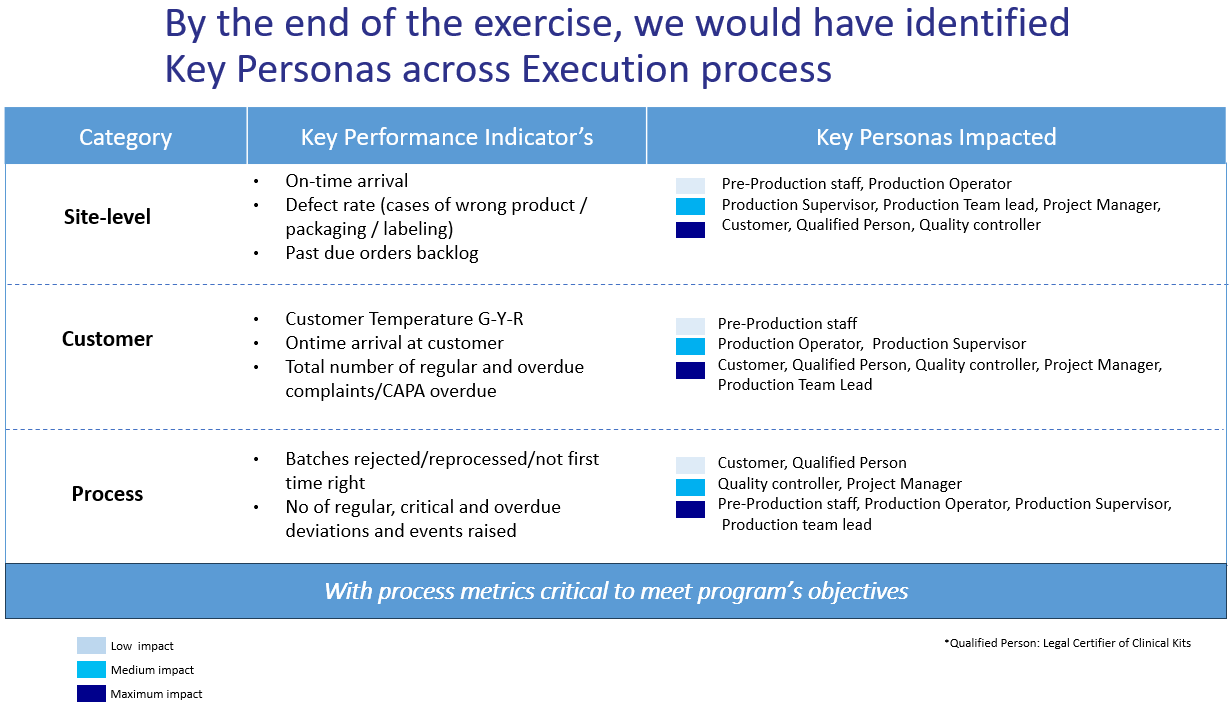
Key users include: Customer Service and Support, Security Admin, Qualified Person, Quality controller.
Product User story
A Product Development lead submits an ingredient request through a centralized system that captures, validates, and enriches data in real time. The workflow automatically routes tasks to the right teams, with clear ownership, tracked feedback, and SLA-driven approvals. What was once a fragmented, manual process becomes streamlined and transparent—enabling faster decisions and full visibility from submission to approval.
Every $1 that an organization invests in user experience results in a return of $100. That’s an ROI of 9,900%!
Problem
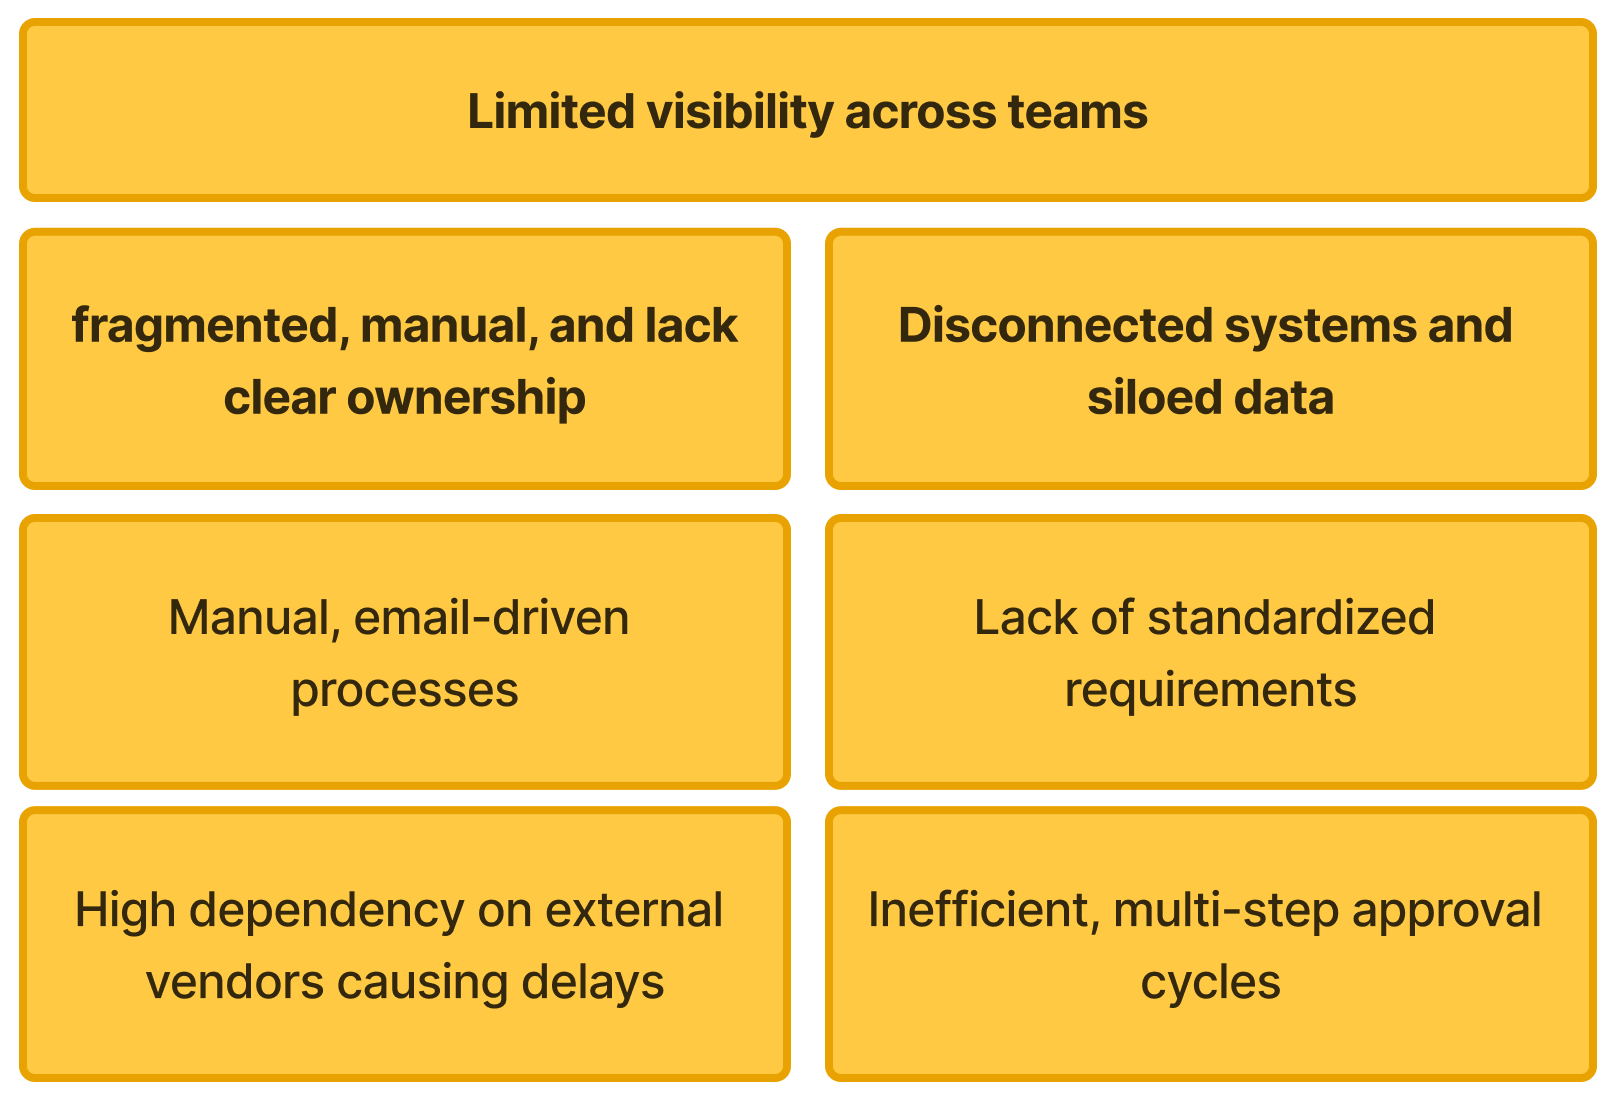
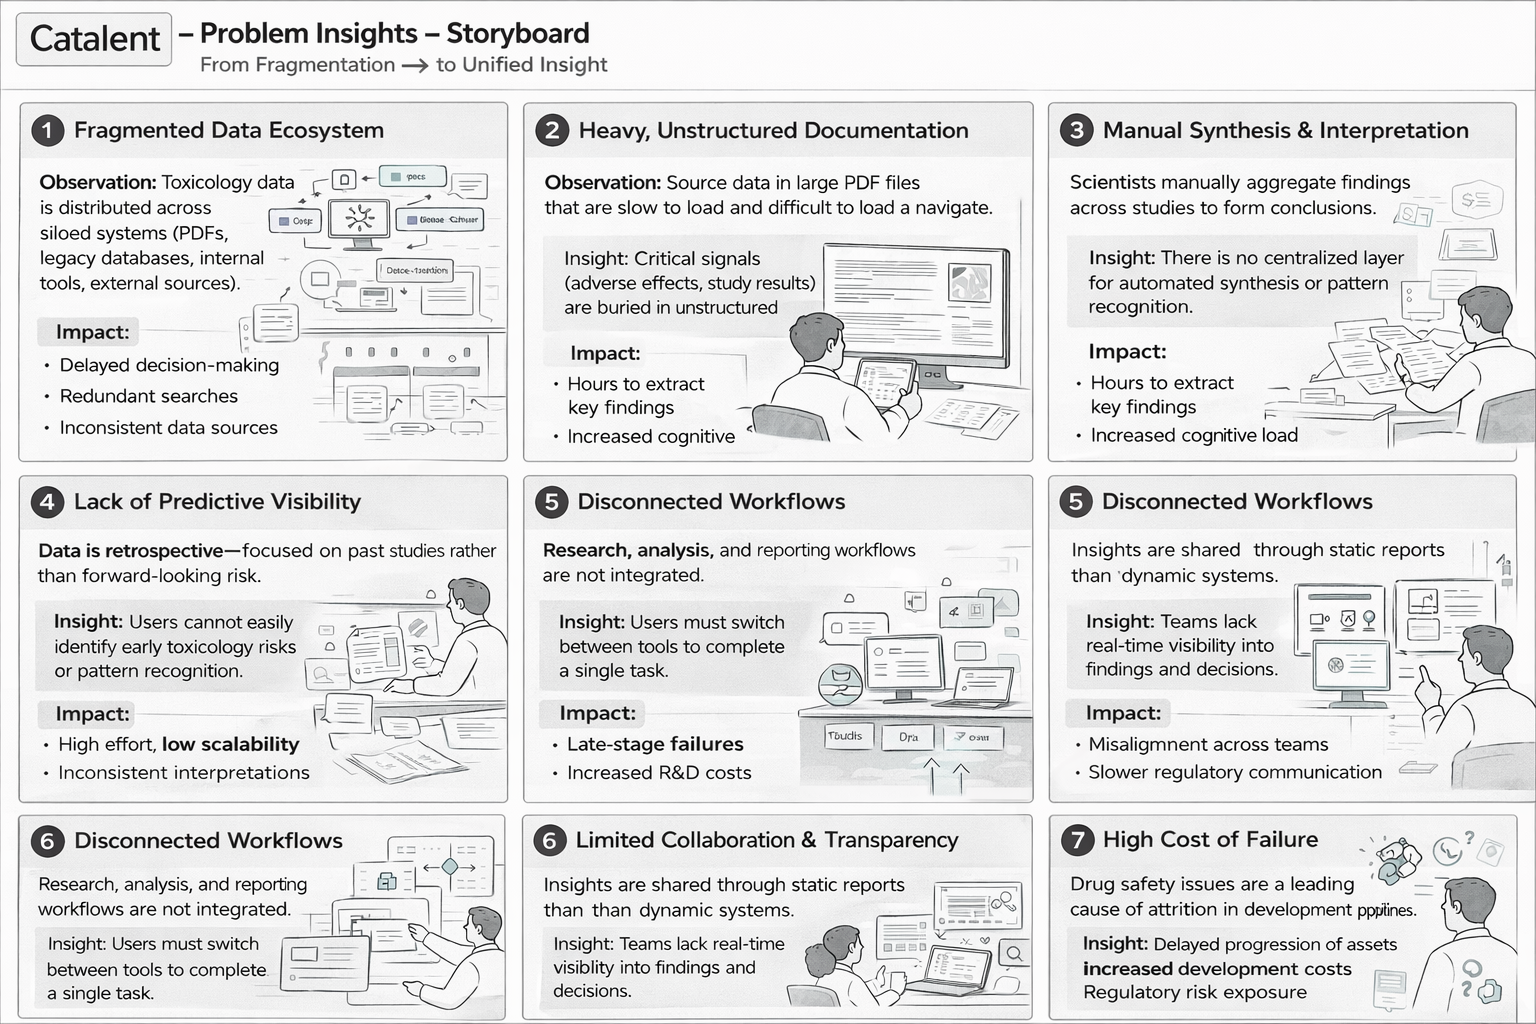
Fragmented workflows and legacy systems created operational inefficiencies:
Risk monitoring spread across disconnected tools
Heavy reliance on manual review and static reporting
Delayed fraud detection and inconsistent decision-making
Limited visibility across business vs. personal account activity
Impact:
Slower response to high-risk transactions
Increased operational overhead
Reduced confidence in risk scoring and compliance workflows
Objective
Design a centralized risk assessment dashboard to:
Enable real-time monitoring of ACH transactions
Standardize risk evaluation workflows
Reduce manual processing and cognitive load
Improve cross-functional visibility and decision-making
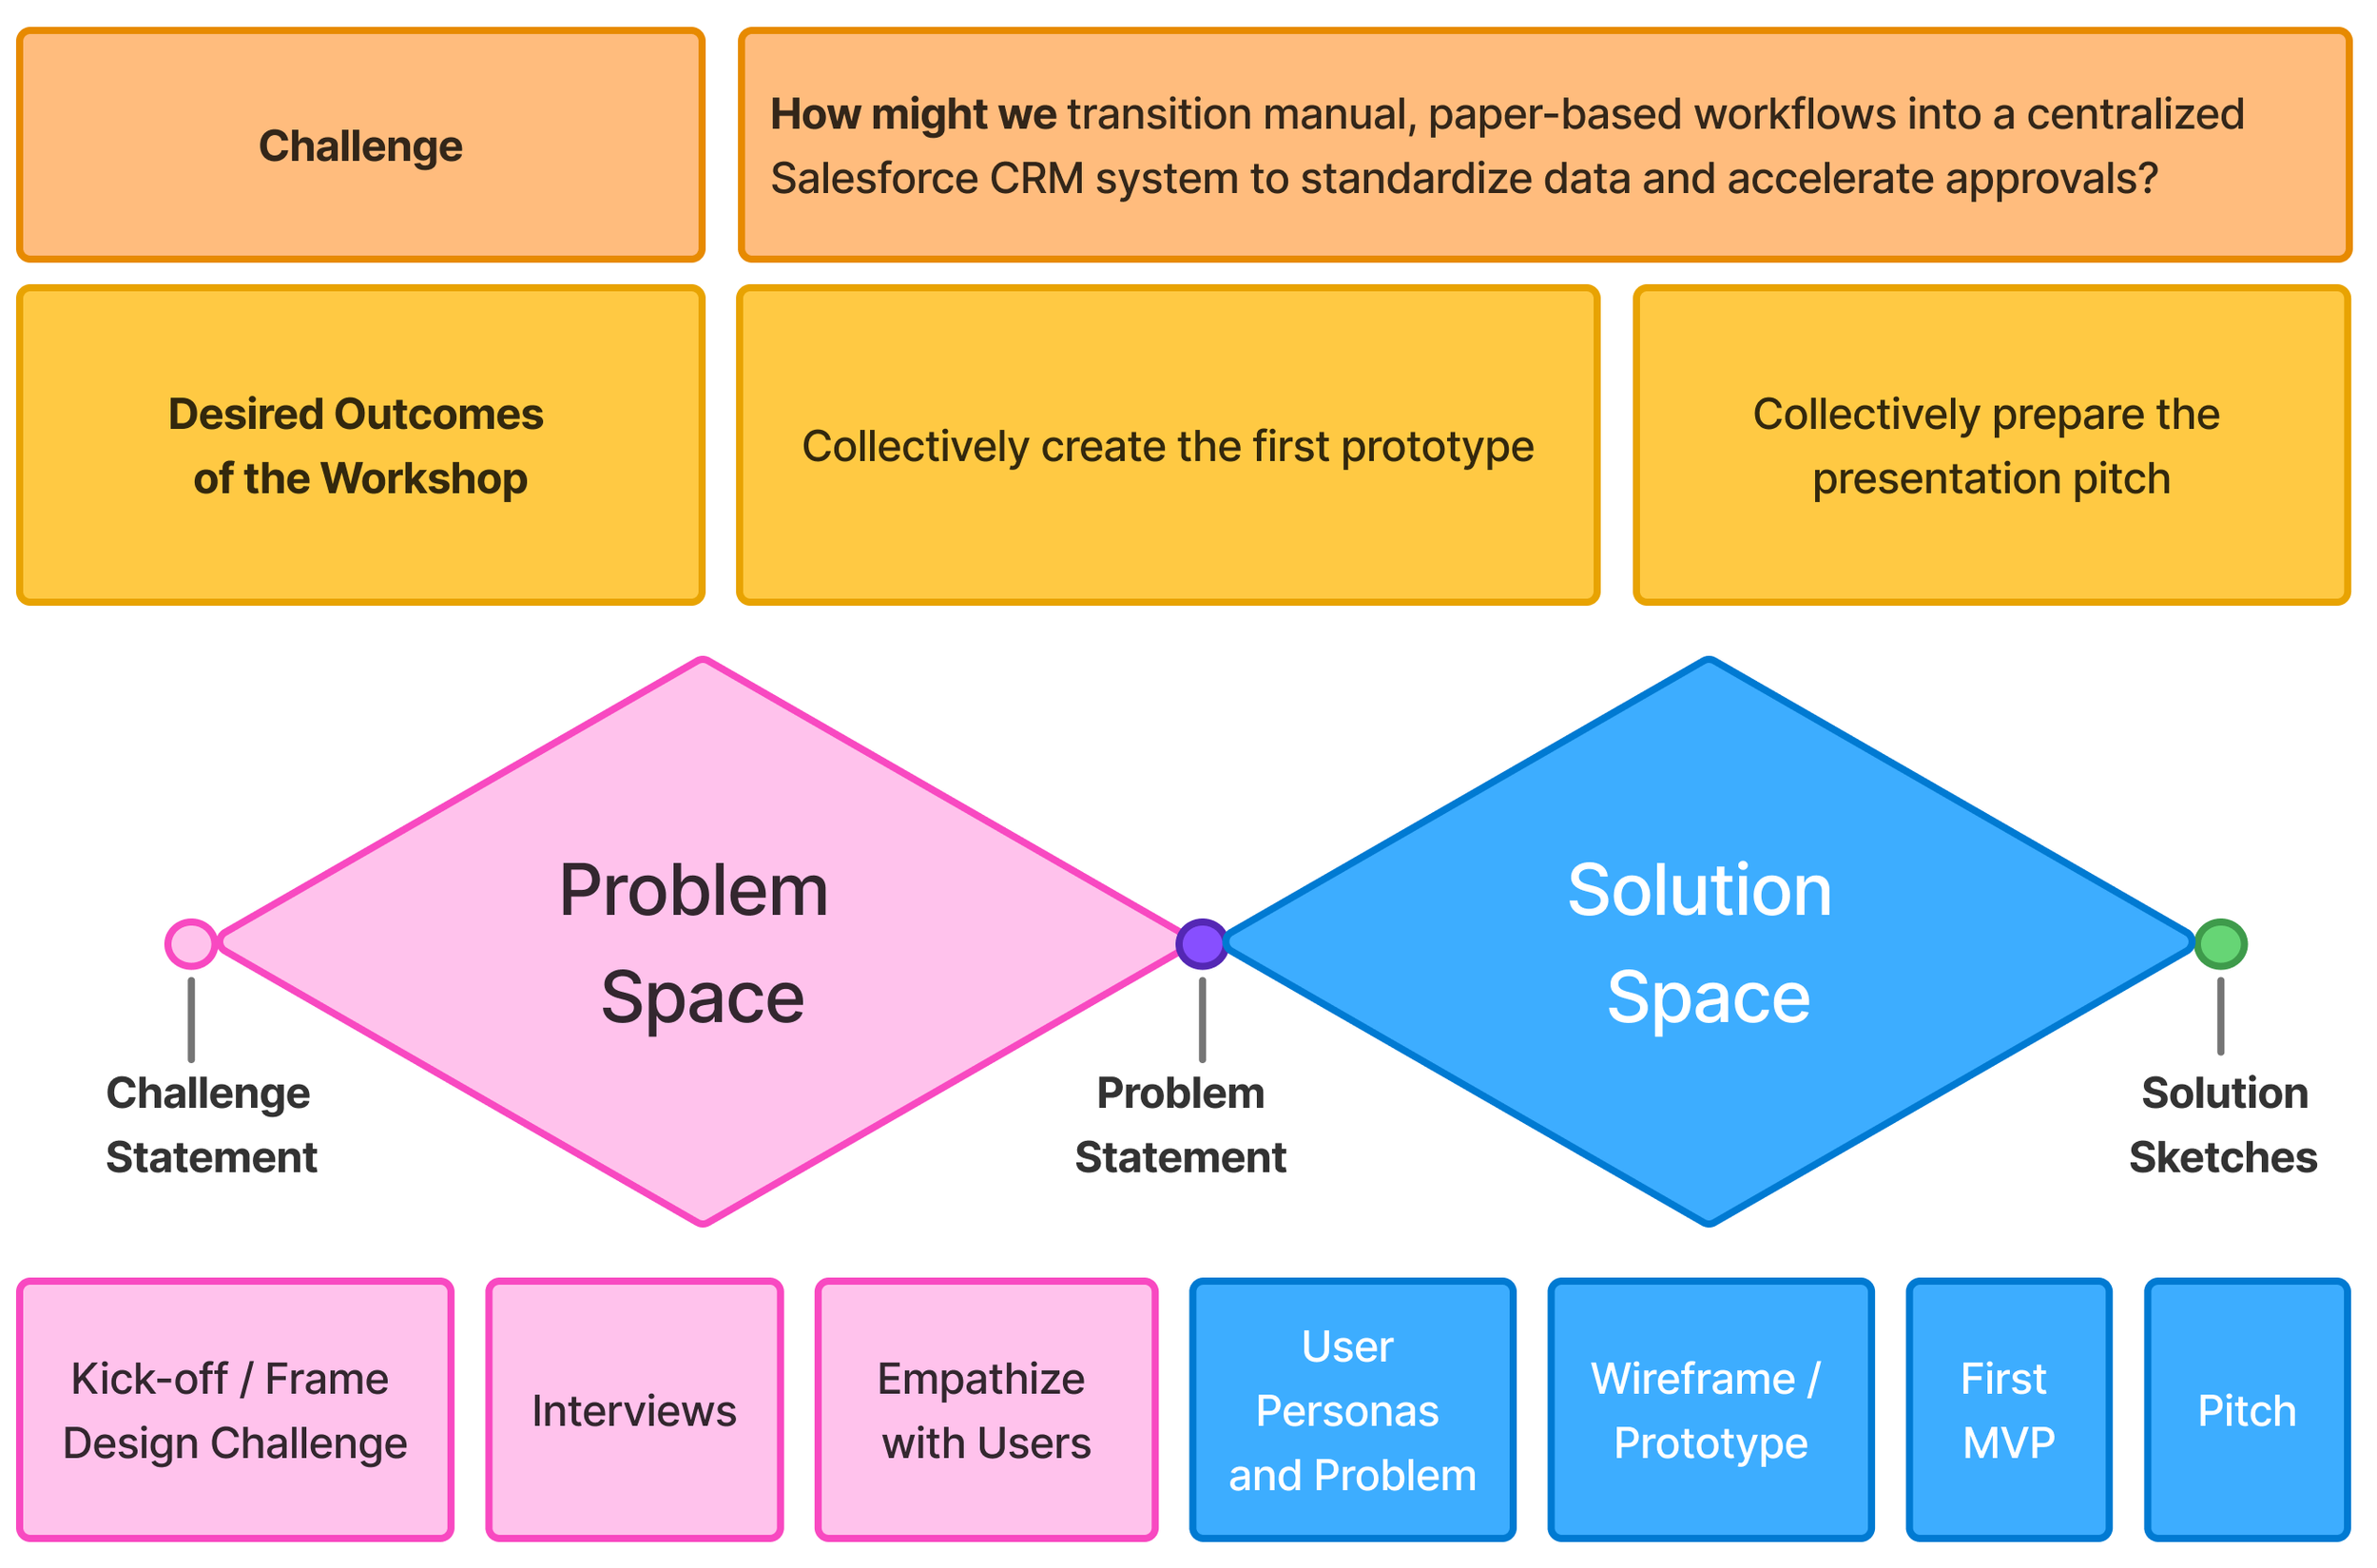
Design Thinking Process
Solution Statement
A centralized ACH Risk Dashboard that:
Aggregates transaction data across systems
Surfaces risk signals through visual prioritization
Enables rapid filtering (account type, transaction size, anomaly patterns)
Supports consistent decision-making across teams
Key Features
Real-time transaction monitoring
Risk scoring indicators and alerts
Unified data view (business + personal accounts)
Workflow-driven UI for faster triage
Scalable design system for future expansion
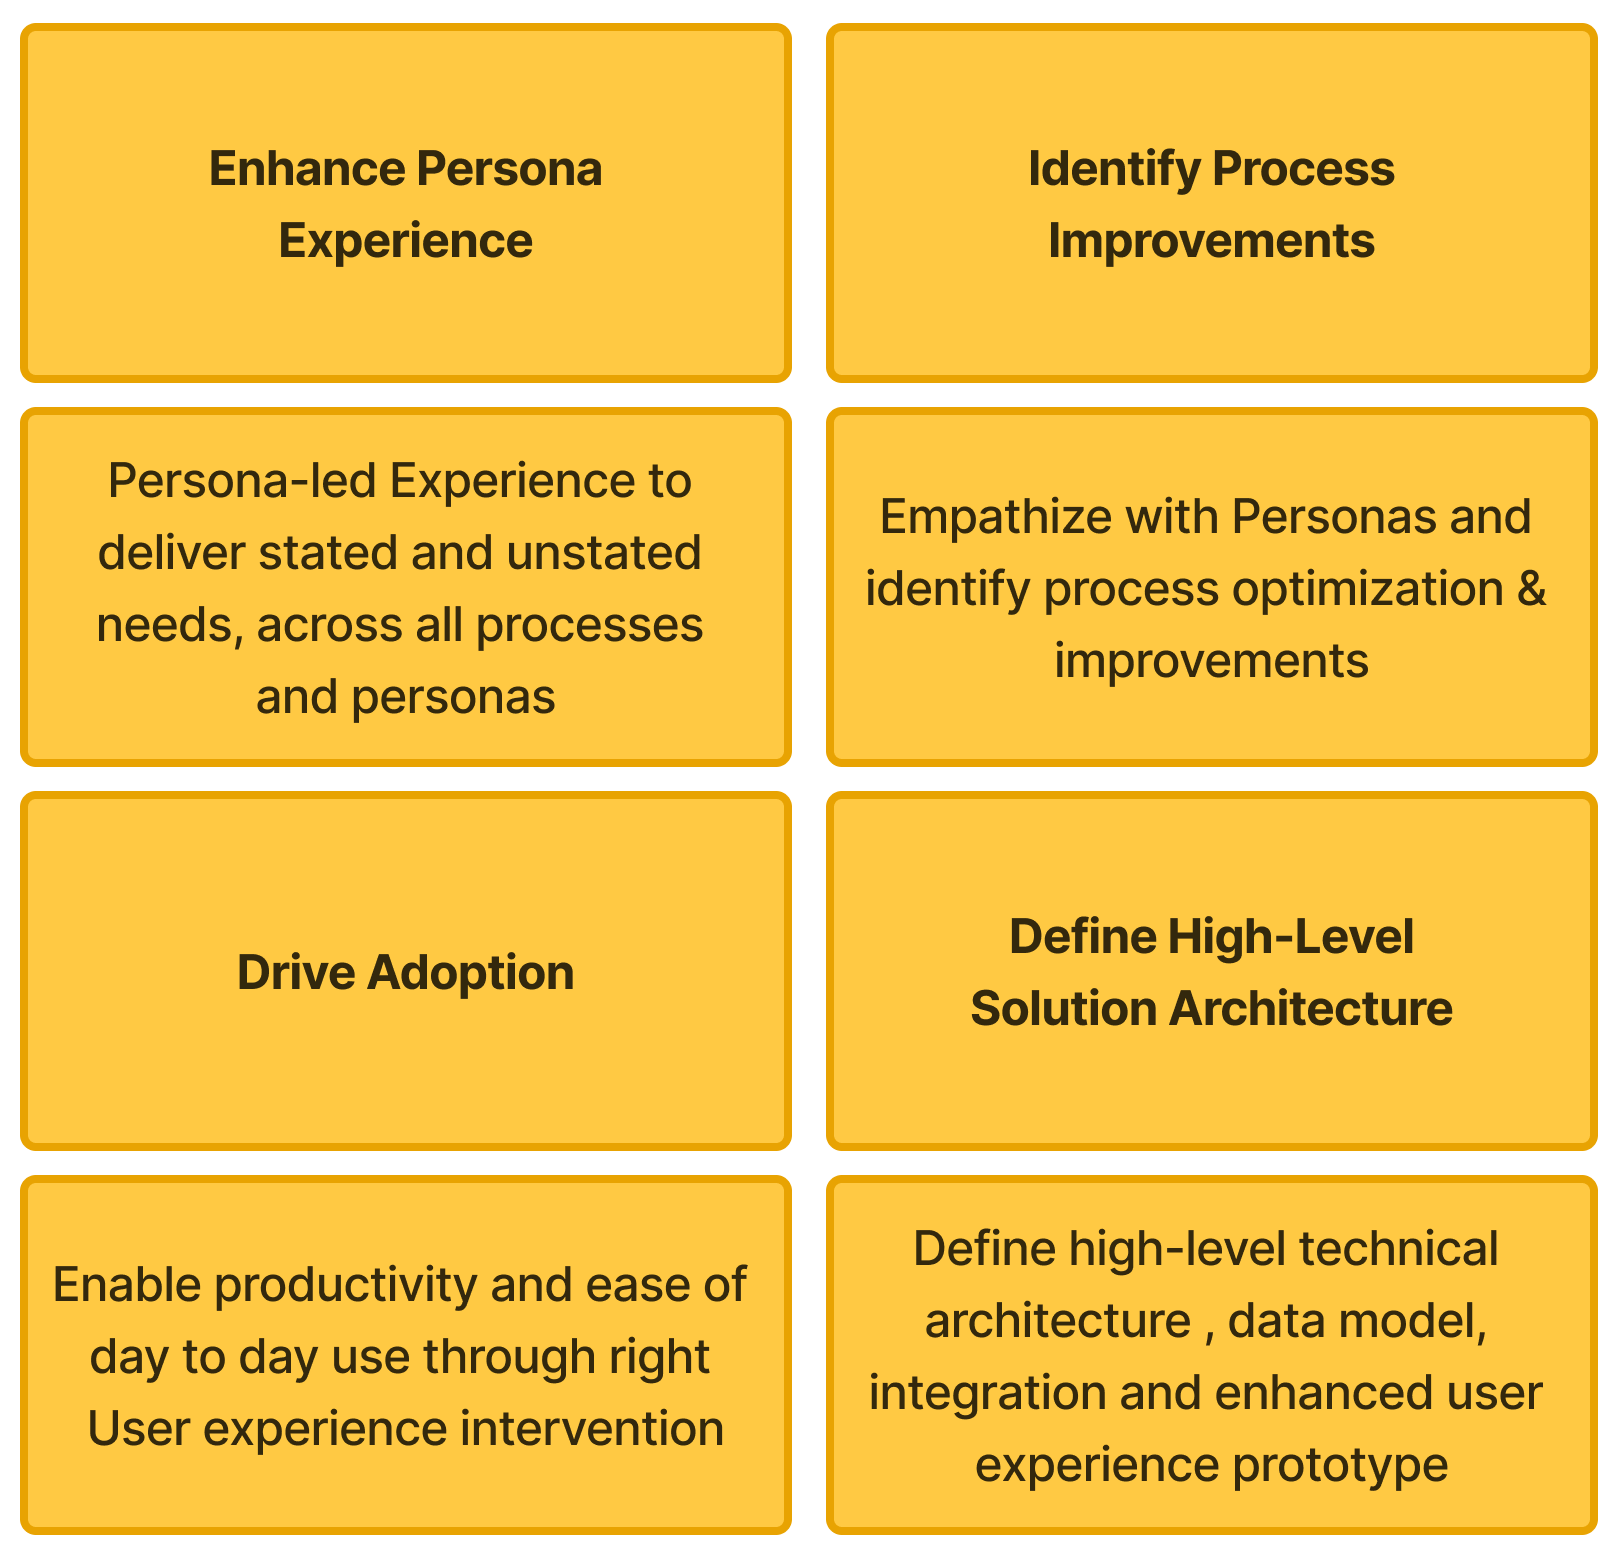
“Redesigned a fragmented risk analysis workflow into a unified intelligence platform reducing time-to-insight by up to 50% while improving detection accuracy and decision confidence.”
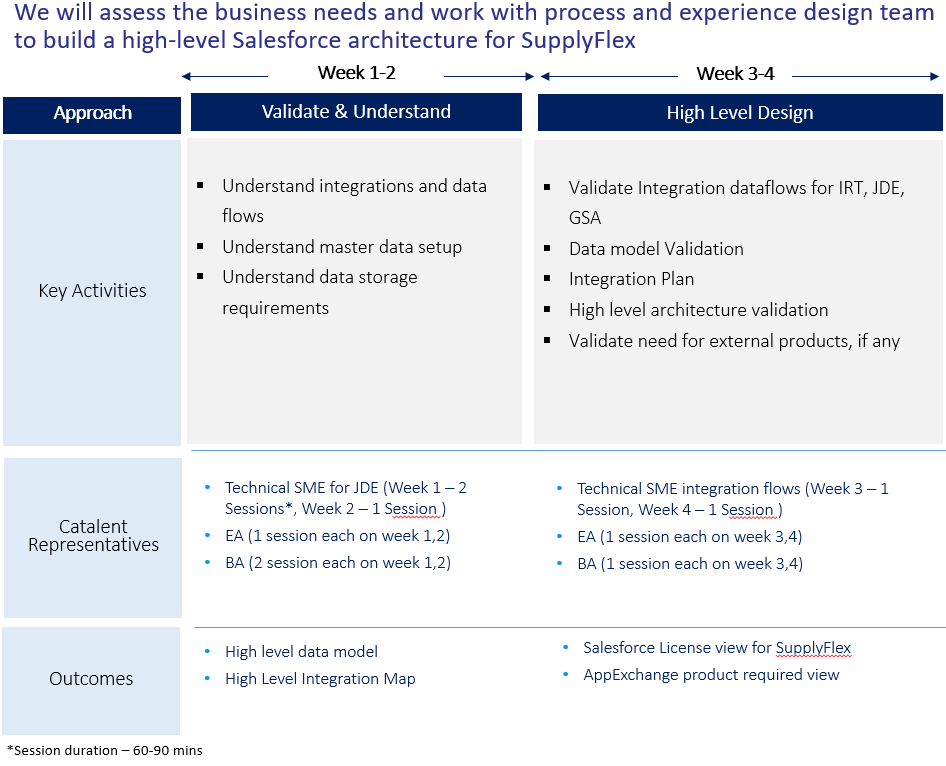

User Research
Conducted end-to-end discovery across stakeholders, team leads, and operational users to define requirements, timelines, and constraints.
Facilitated stakeholder interviews and cross-functional workshops
Designed and distributed questionnaires for global team input
Conducted 1:1 interviews with managers and supervisors
Led a Design Sprint with teams across 4 continents (including on-site sessions at Catalent)
Design Artifacts
User journeys and flow diagrams
Information architecture models
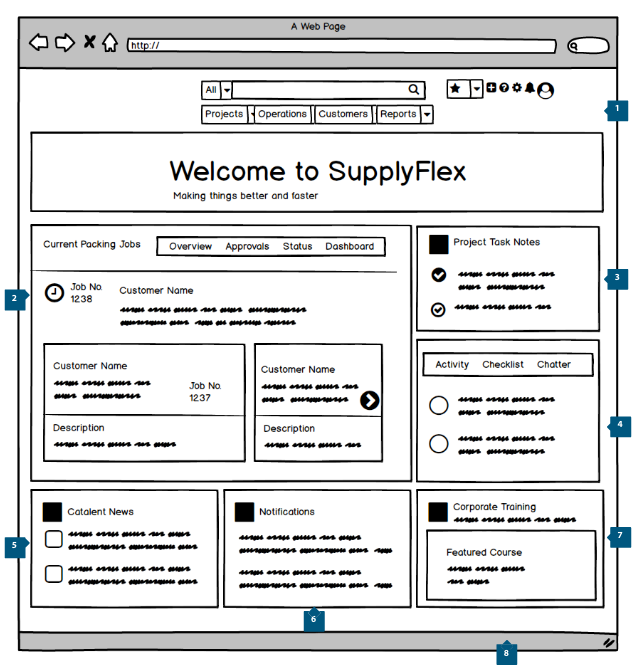
Wireframes and interactive prototypes
Usability testing insights and iteration logs
Final production-ready UI assets
Key Learnings
Visualization clarity is critical in high-risk decision environments
Simplifying workflows drives both adoption and compliance
Early alignment with engineering reduces downstream friction
Iterative testing (even low-fidelity) significantly improves usability outcomes
Value Added
This project positioned Q2 to:
Scale risk monitoring across growing transaction volumes
Improve operational efficiency and compliance readiness
Deliver a more reliable, data-driven banking experience
OKRs
Objective 1: Accelerate Risk Analysis Workflows
KR1: Reduce average analysis time per transaction by 30%
KR2: Increase task completion rate by +25%
KR3: Reduce system-switching events per session by 40%
Objective 2: Improve Risk Detection Accuracy
KR1: Increase high-risk signal detection rate by +20%
KR2: Reduce missed critical alerts by -25%
KR3: Improve confidence score (user-reported) by +15%
Objective 3: Drive Platform Adoption
KR1: Increase daily active usage by +30%
KR2: Achieve 70%+ workflow completion within platform (no external tools)
KR3: Reduce reliance on external research tools by 50%
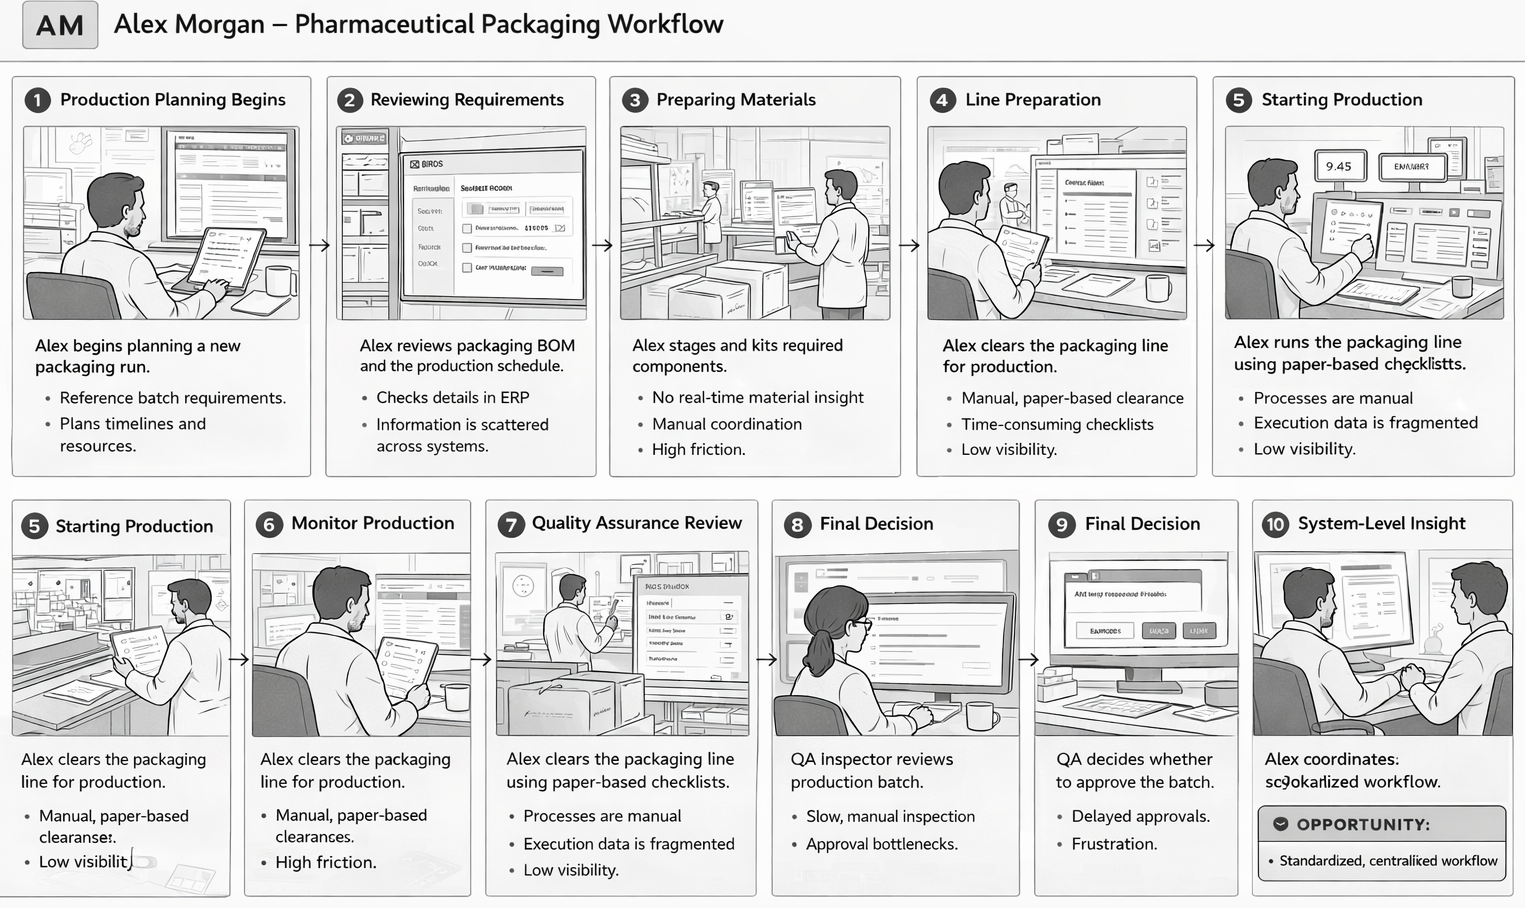
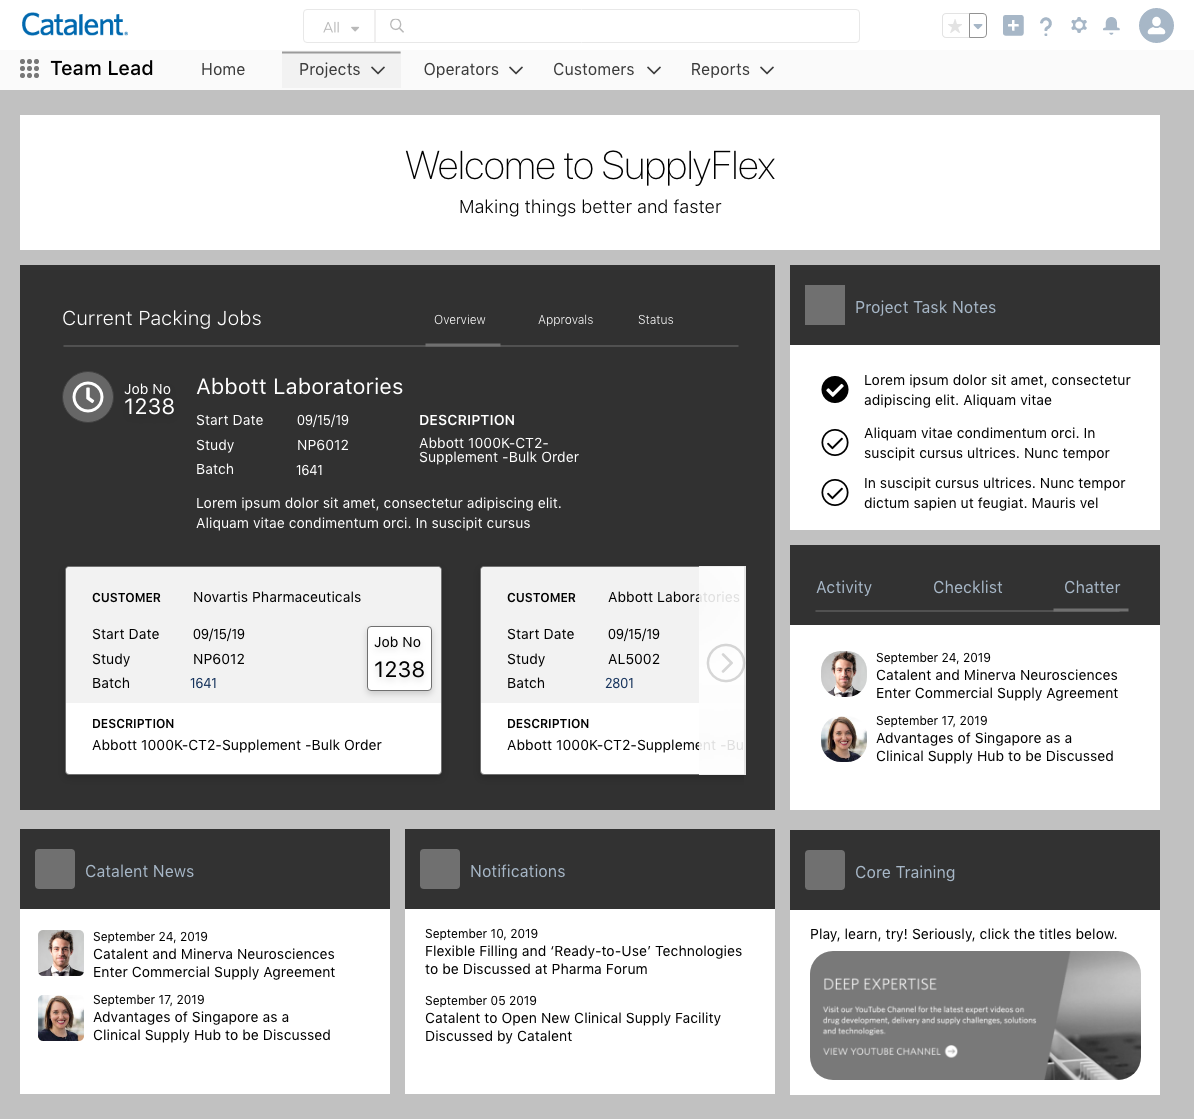
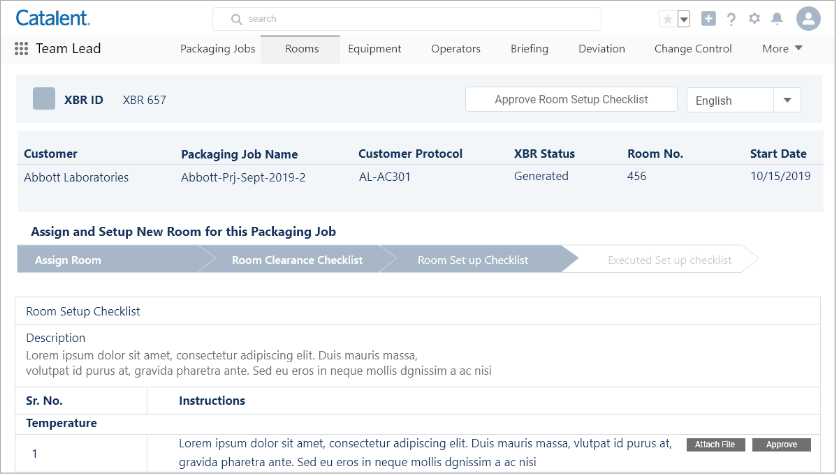
Value Proposition: Transform manual, paper-based workflows into a centralized Salesforce CRM system that standardizes data, reduces manual effort, and accelerates approvals—enabling faster, more efficient, and transparent operations.
Established scalable UX framework for future internal tools
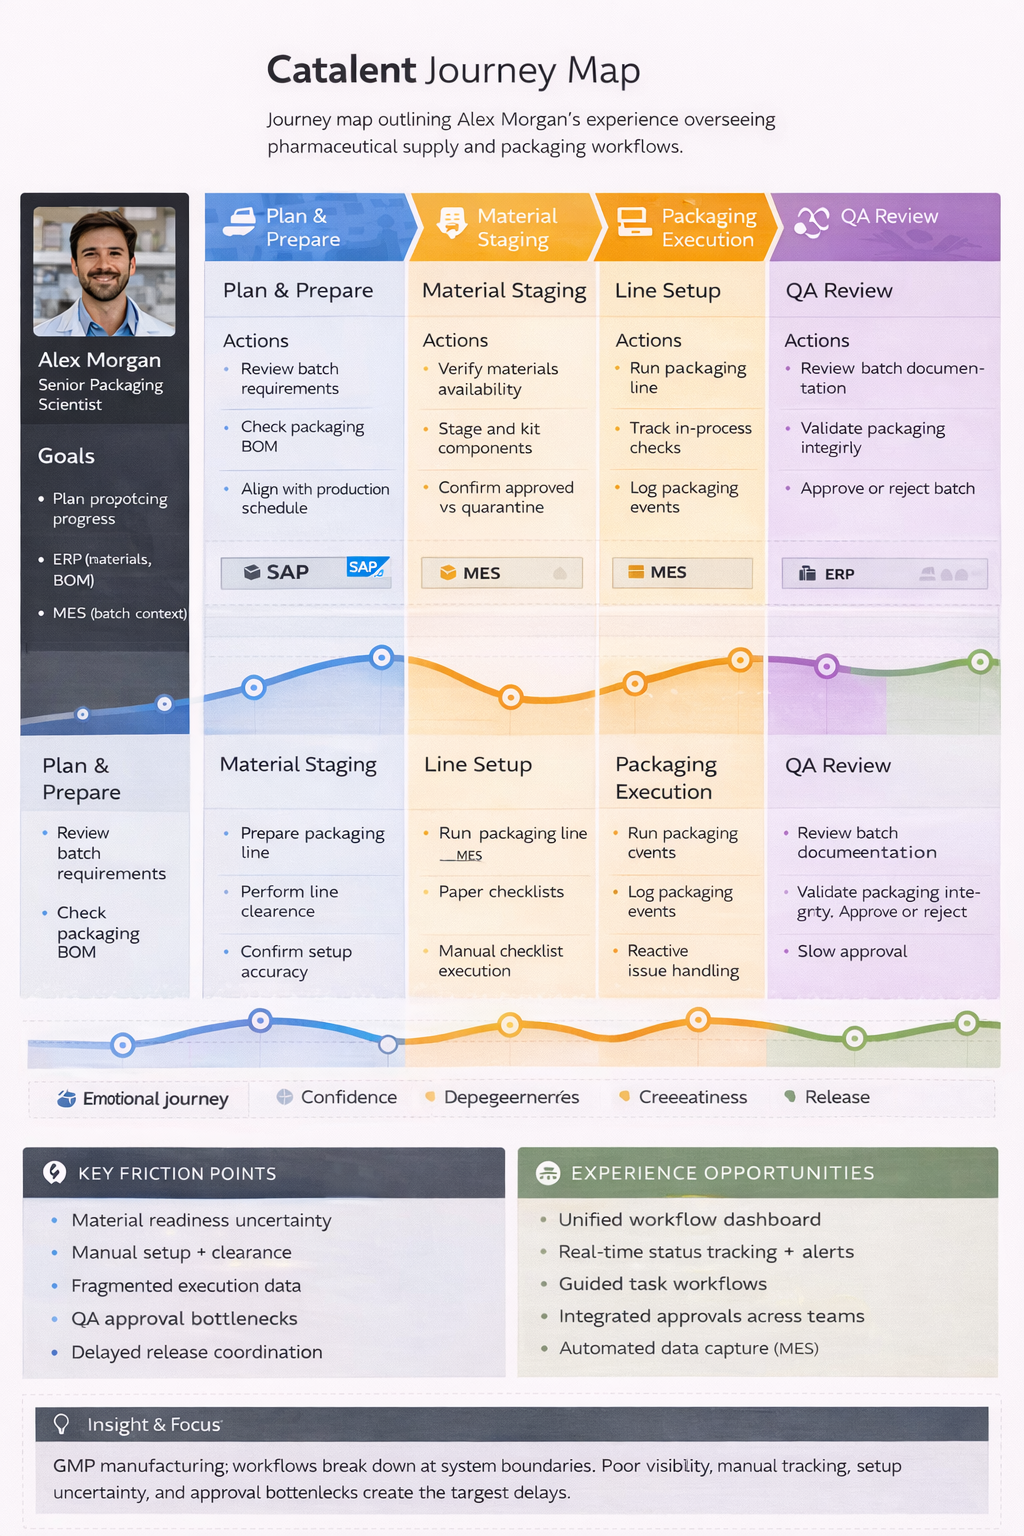
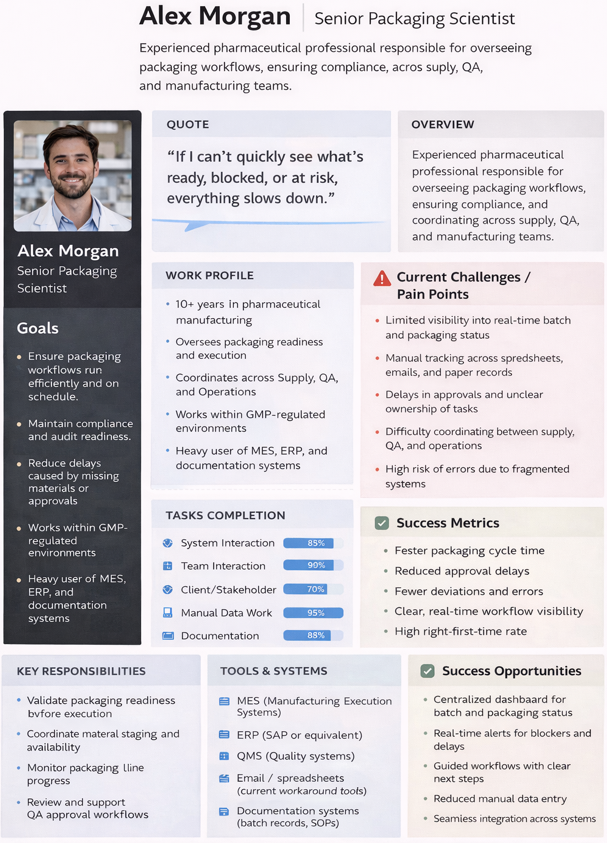
Problem → Insight → Solution storyboard
Reduced ambiguity in project tracking across global teams
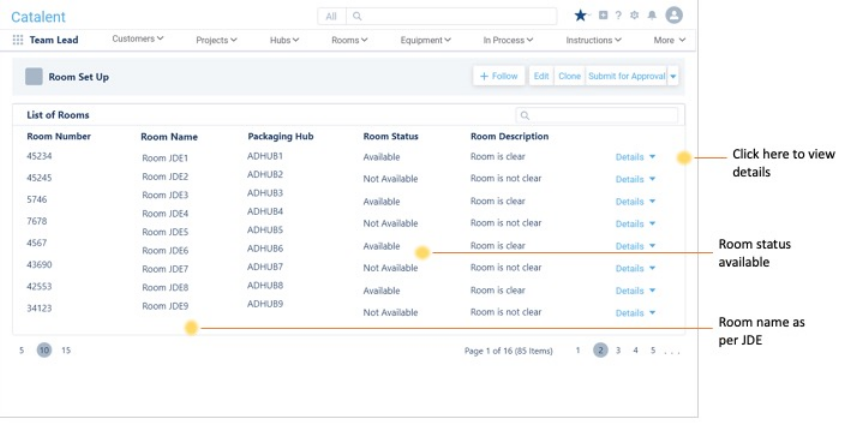
“We defined success not just in usability, but in how effectively the system structures data for machine learning and improves early risk detection.”
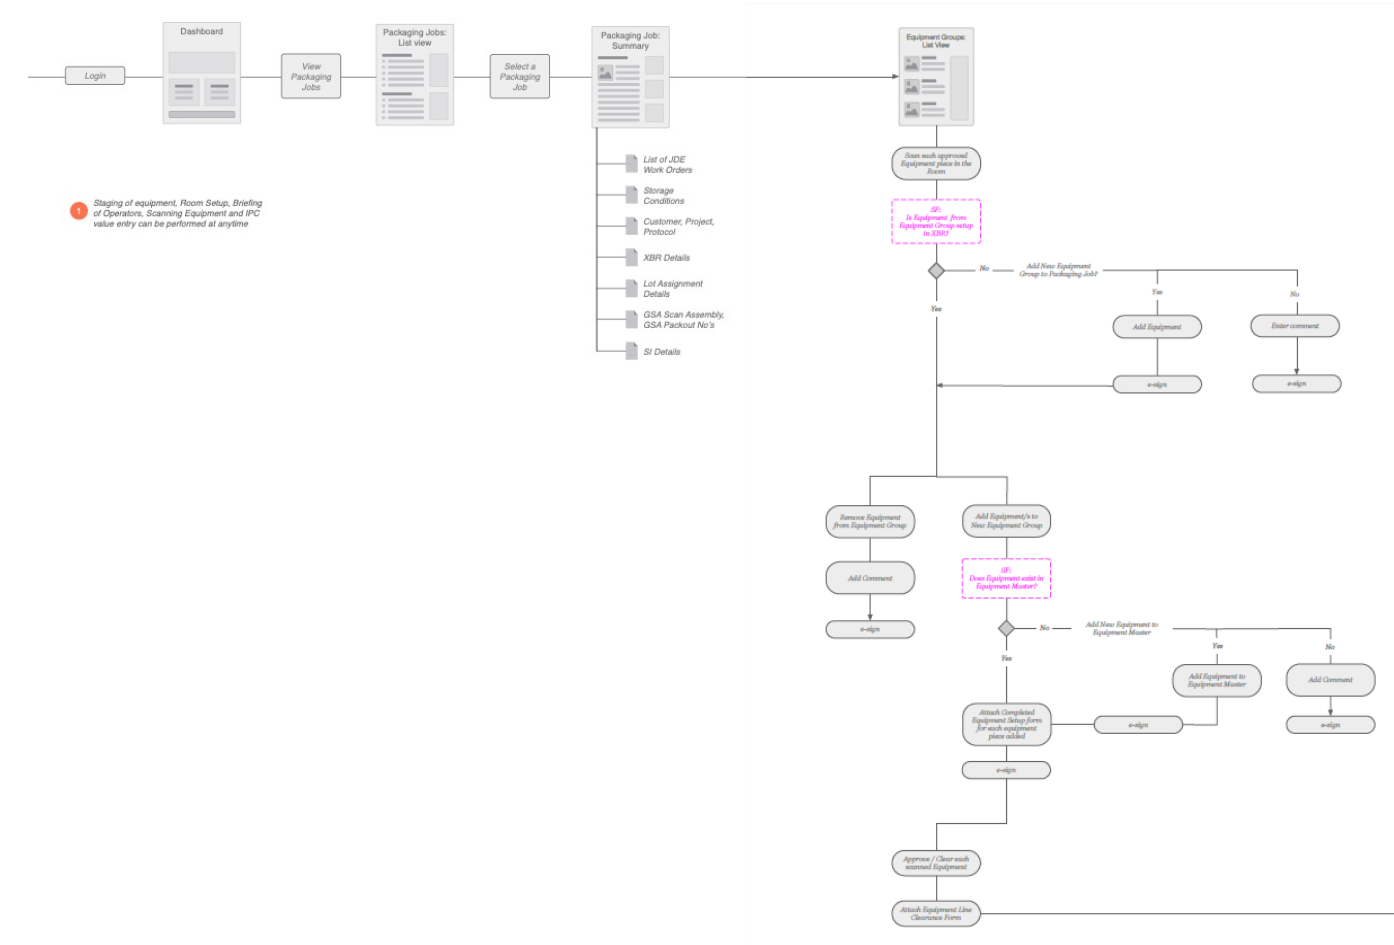
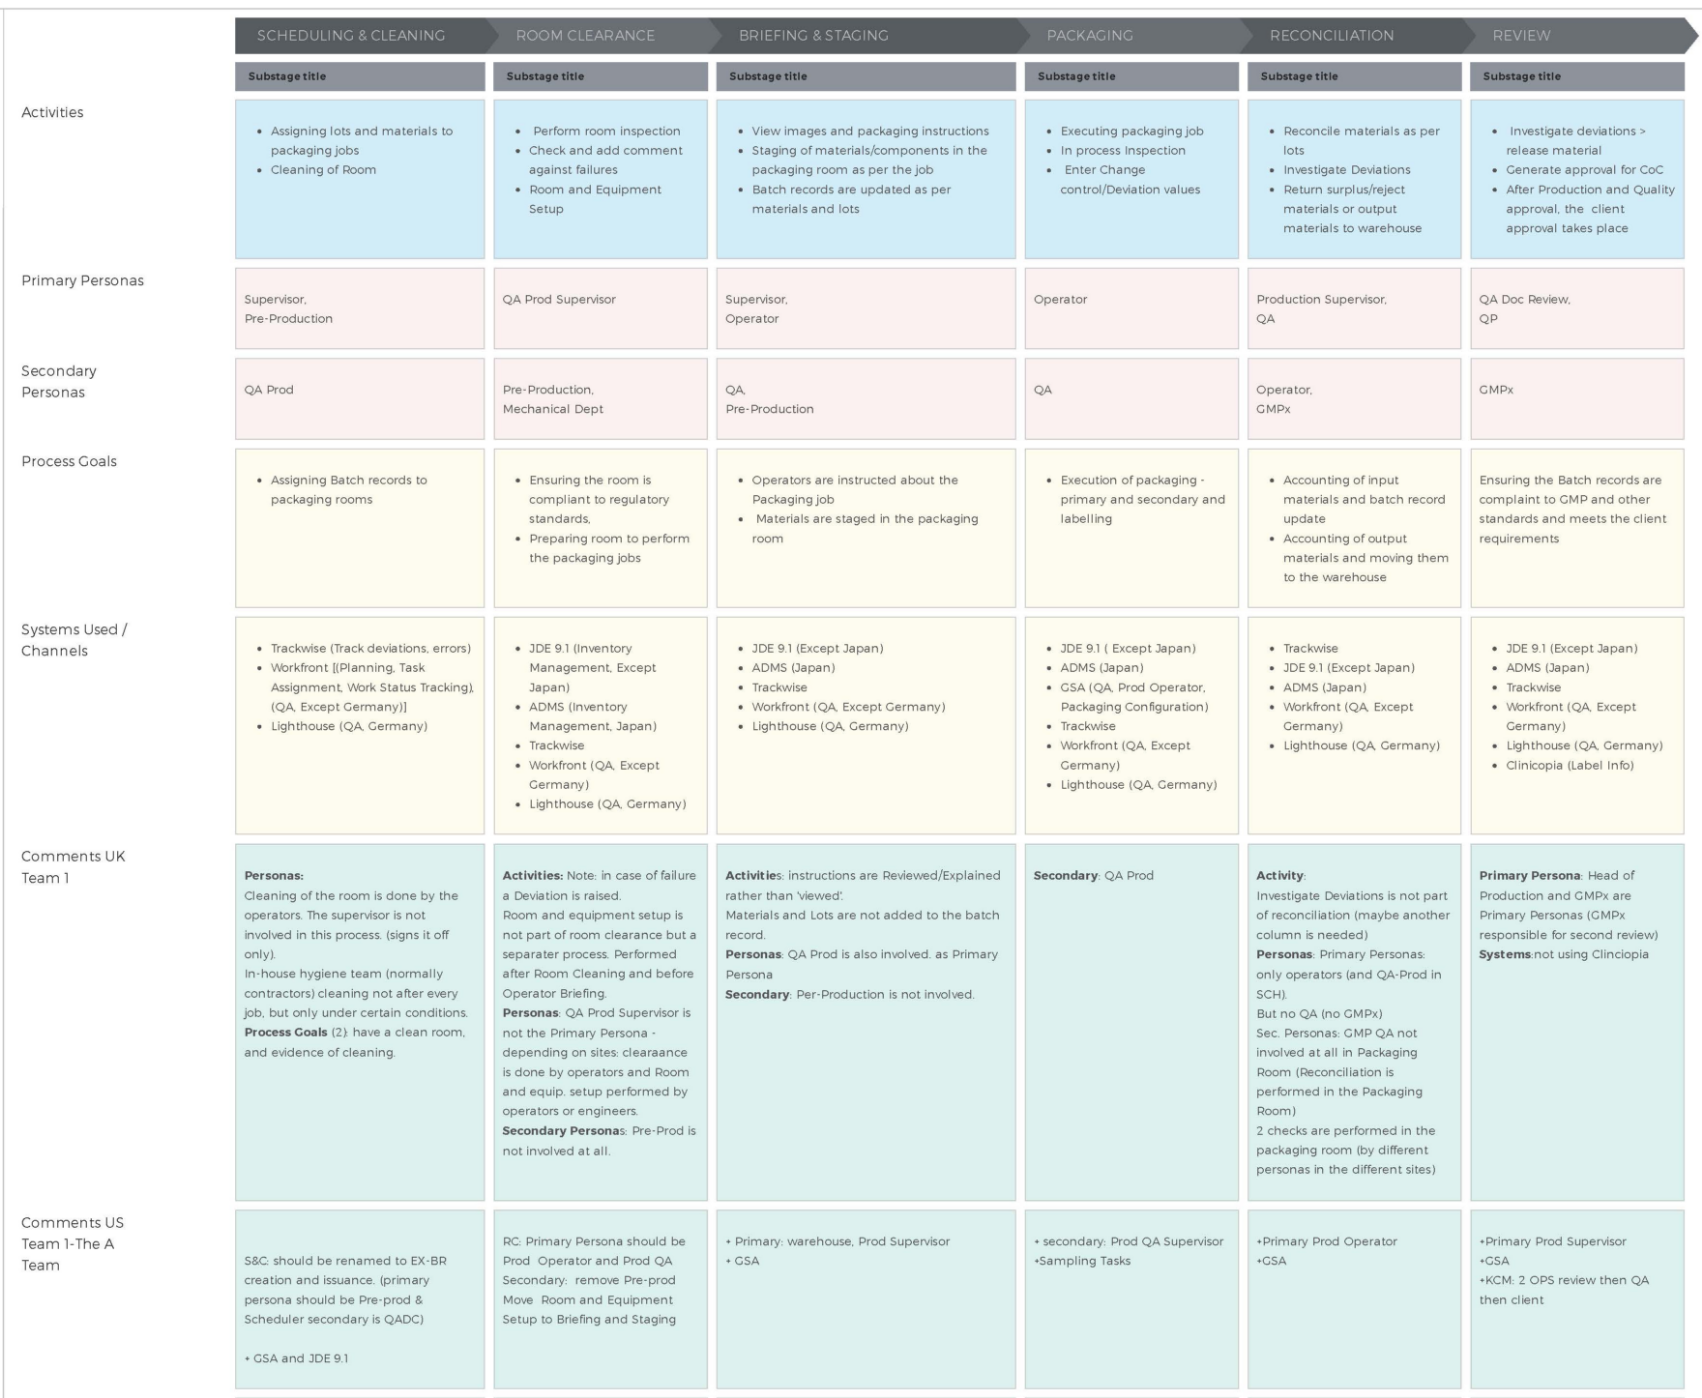
“We aligned KPIs to each stage of the user journey to ensure we weren’t just improving usability, but accelerating decision-making and generating structured data for machine learning.”
Impact
While exact metrics were not formally published, the solution was designed to drive:
Measured by:
20–40% reduction in manual review effort
Faster fraud detection cycles through real-time visibility
15–30% improvement in task completion efficiency
Increased adoption of standardized risk workflows across teams
Result:
A scalable, data-driven operational model that increases throughput, reduces risk, and improves cross-functional coordination in pharmaceutical manufacturing.