< Back Case Study | BioTech
Nonclinical Drug Safety Platform
Project Overview
Client: Boehringer Ingelheim
Industry: Pharma
Platform: Web, Tablet
Focus: Risk assessment, trending, historical data & personalization
Role: Senior Product Designer (UX + Research)
Scope: End-to-end (Discovery → MVP)
Environment: Pharmaceutical R&D / Non-clinical drug safety
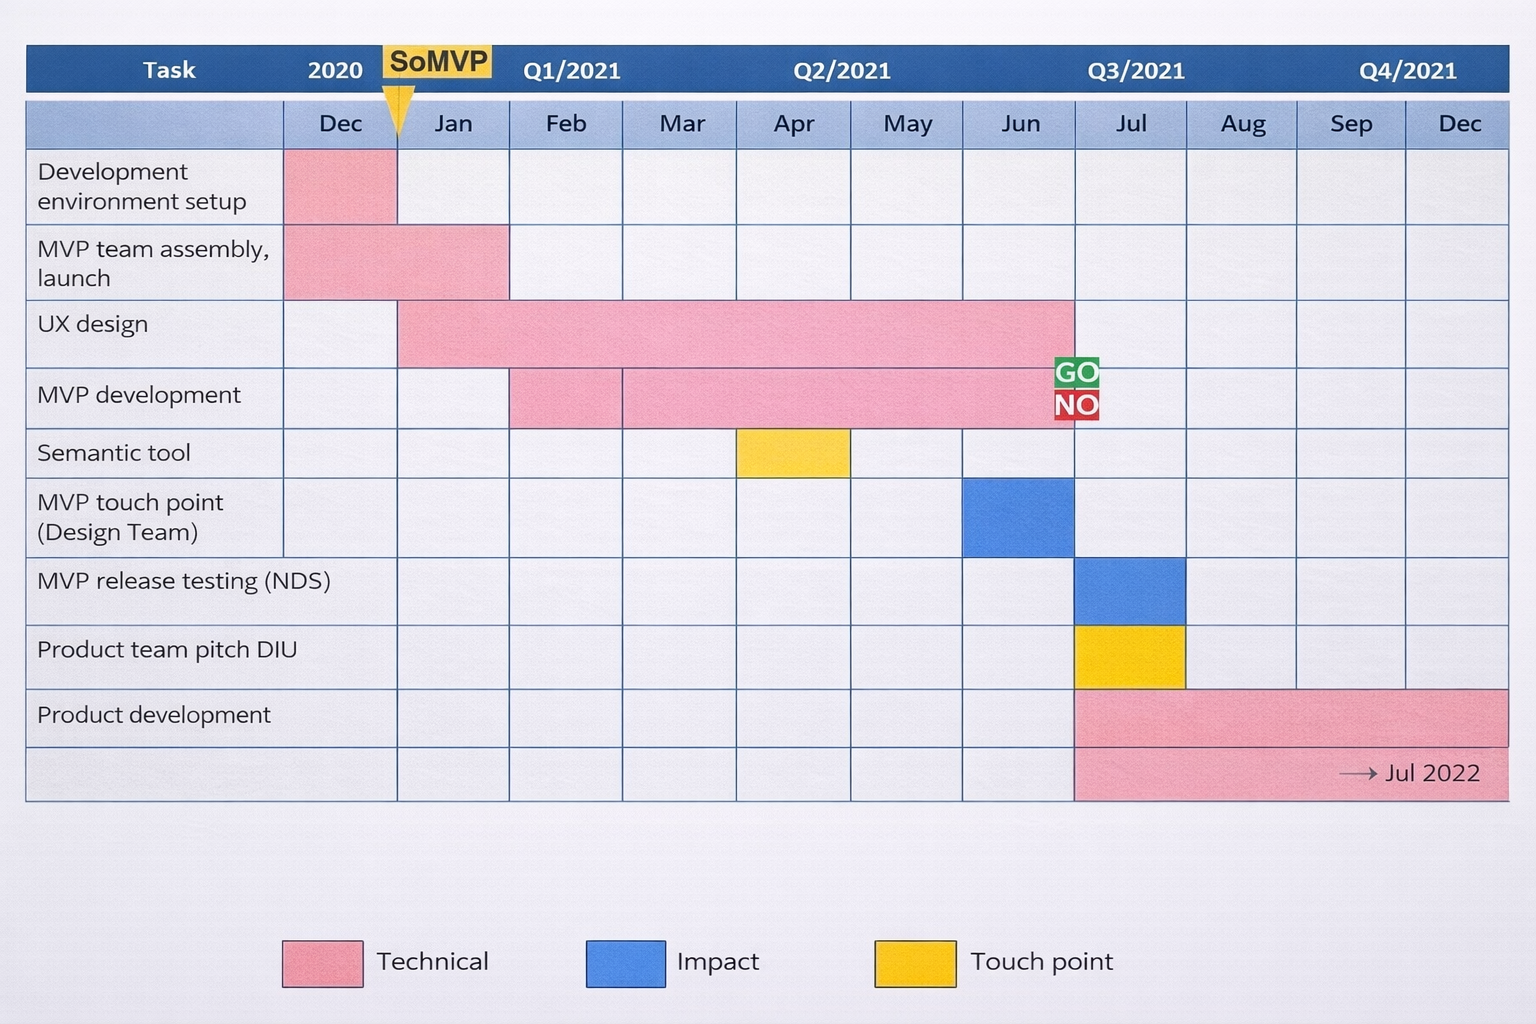
Timeline: ~12 months
Nonclinical drug safety platform
The platform enables a unified research workflow by eliminating the need to switch between internal reports and external tools. Instead of navigating across platforms, users can access toxicology data, literature insights, predictive signals, and adverse event analysis within one centralized system.
Users:
Key users include pathologists, toxicologists, and discovery researchers.
Data Sources: D360, Toxcast, TGgates, ChemBL, PubMed, Google Scholar
Every $1 that an organization invests in user experience results in a return of $100. That’s an ROI of 9,900%!
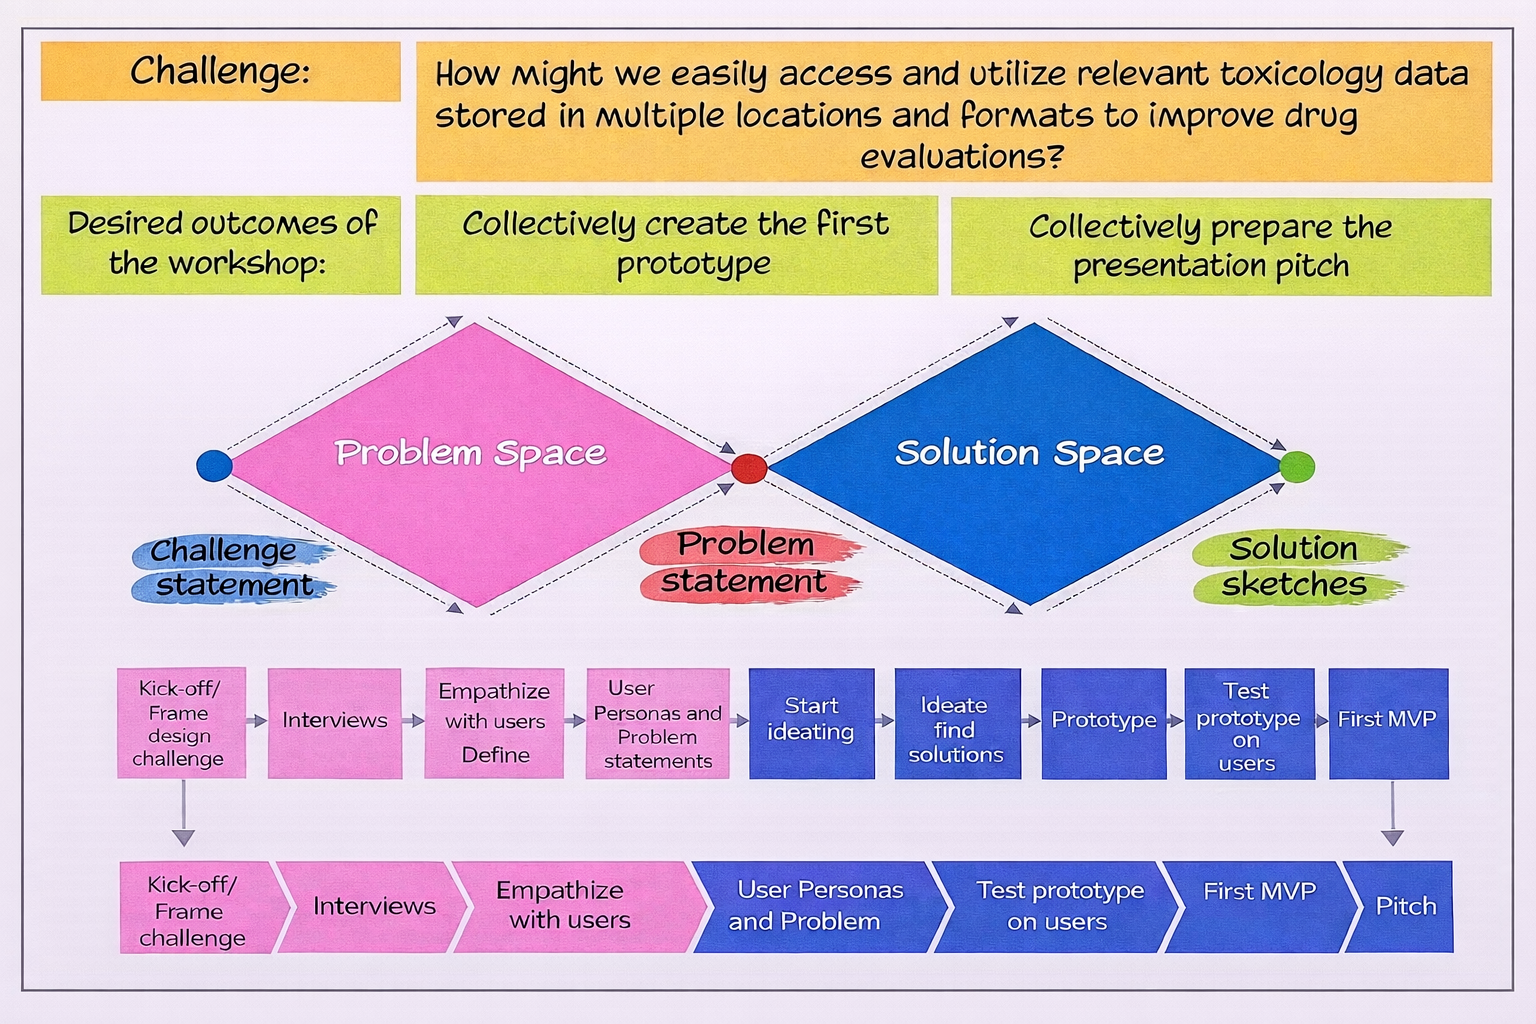
Design Thinking Process
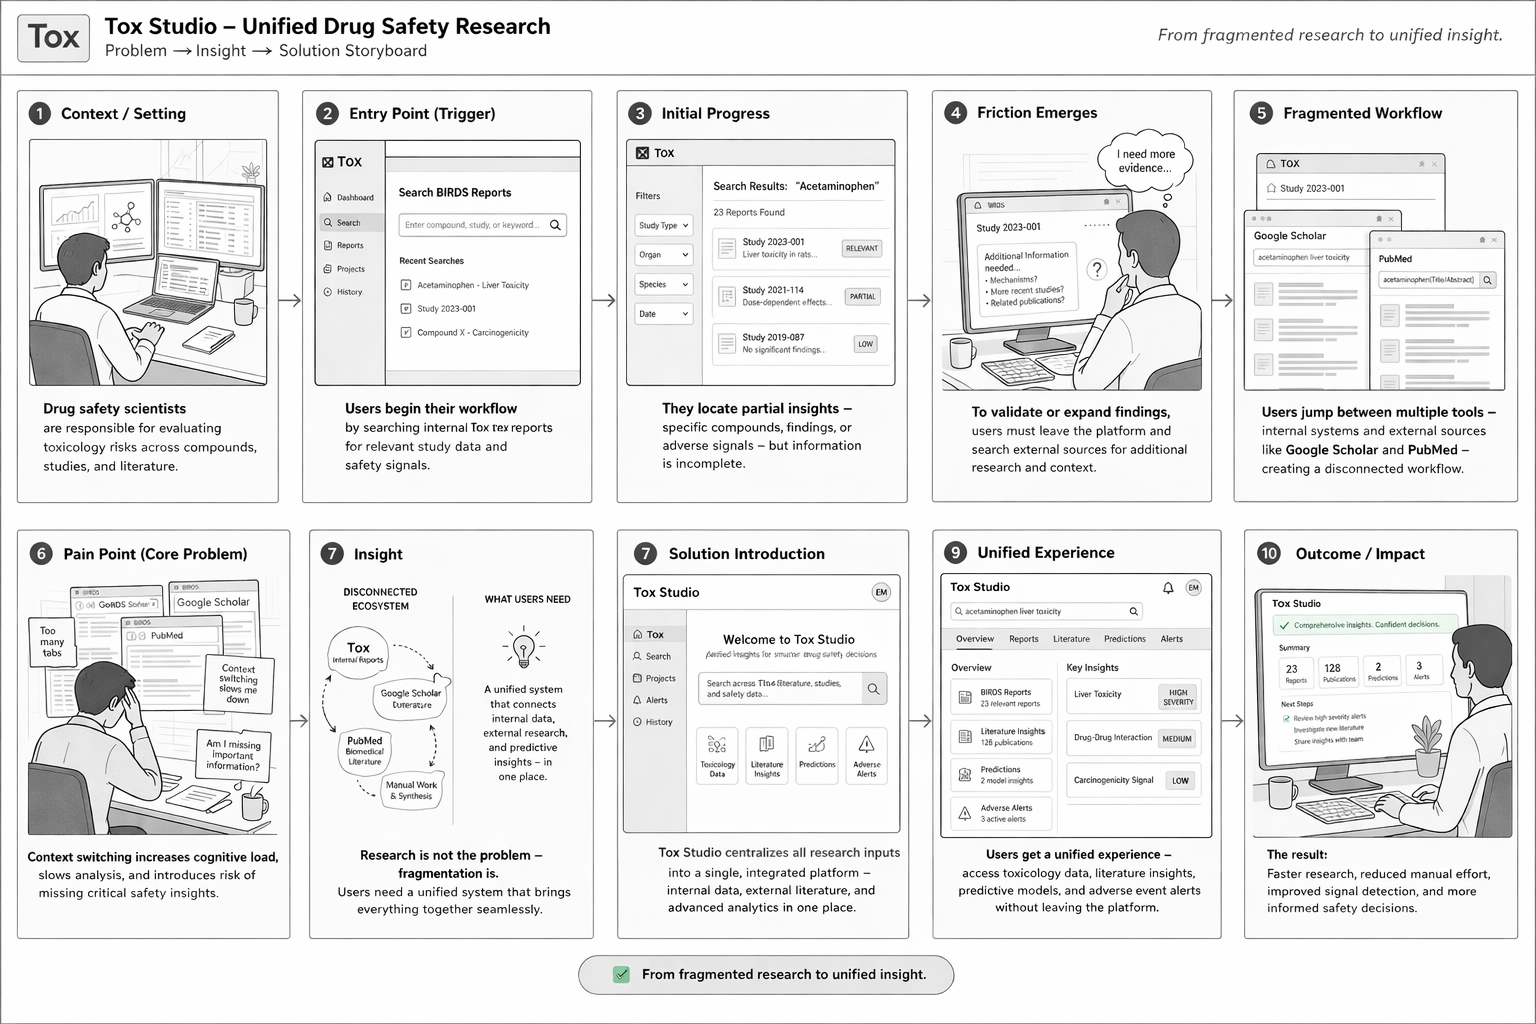
Problem (Current State)
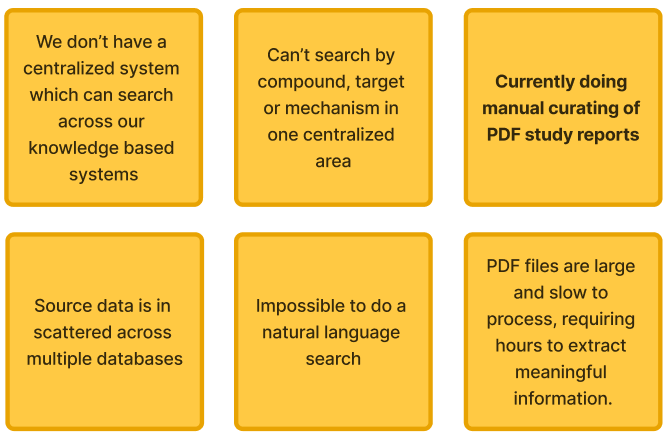
Users begin by searching internal BIRDS reports to find relevant toxicology or study data. When additional context or validation is needed, they must leave the system and conduct external research using sources like Google Scholar or PubMed.
This fragmented workflow:
Introduces context switching
Slows down research velocity
Increases cognitive load
Creates gaps in insight synthesis
Solution Statement
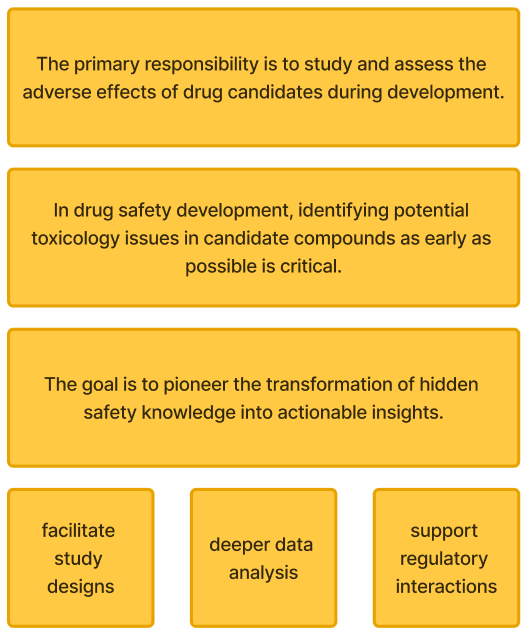
The platform connects users to all safety-related data in one platform to facilitate study designs, deeper data analysis, regulatory interactions; Enhance investigative, de-risking and support predictive toxicology models.
User Problem: Manual cross-study comparison High cognitive load interpreting complex toxicology data Lack of unified, visualized insights
Why It Matters: Delayed or missed safety signals directly impact:
Drug development timelines
Regulatory risk
Patient safety outcomes
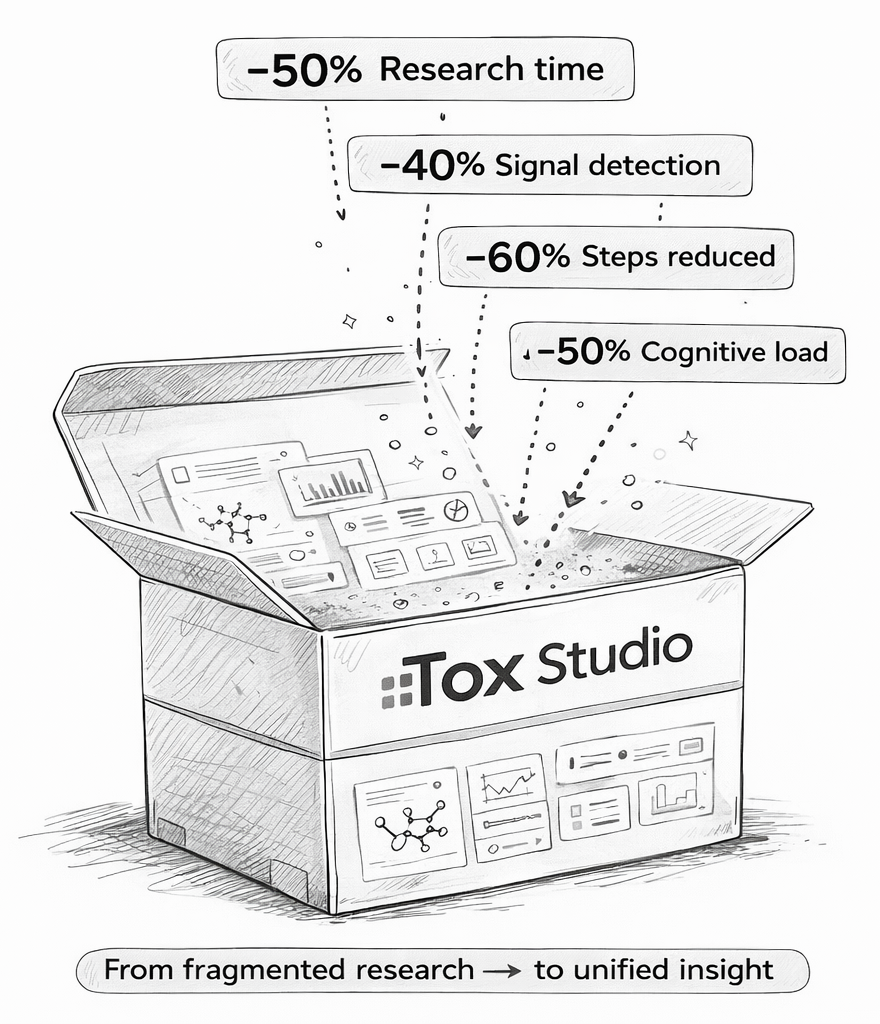
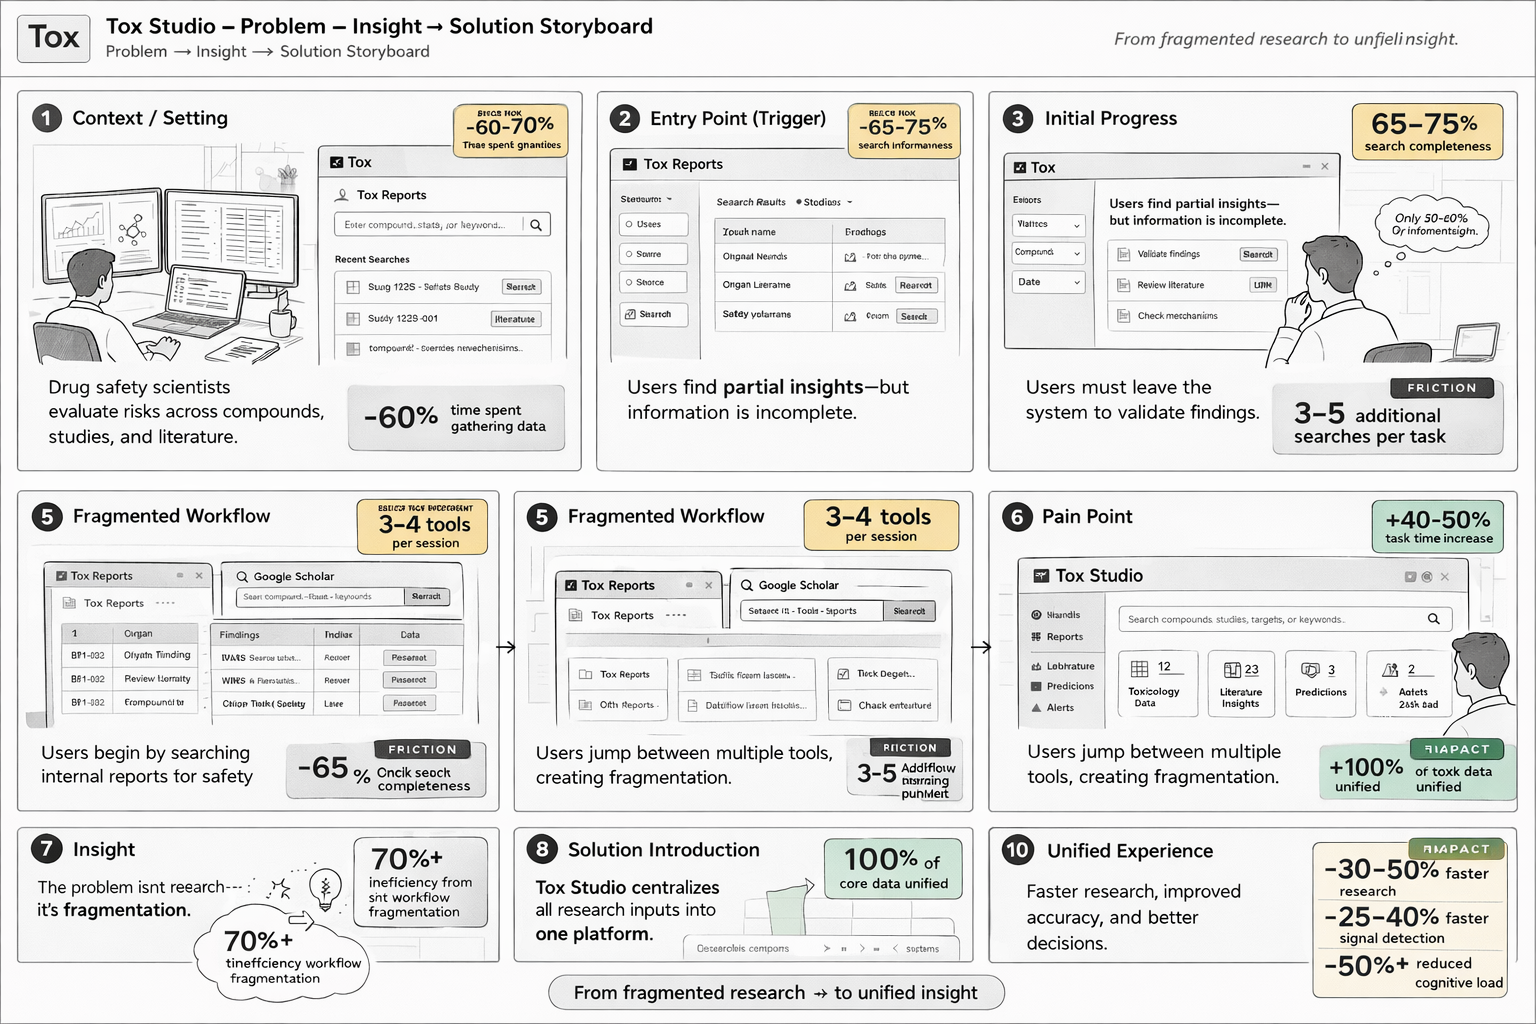
Designed an AI-driven toxicology platform that transformed fragmented safety data into actionable insights, reducing analysis time by ~40% and achieving 95% user satisfaction.
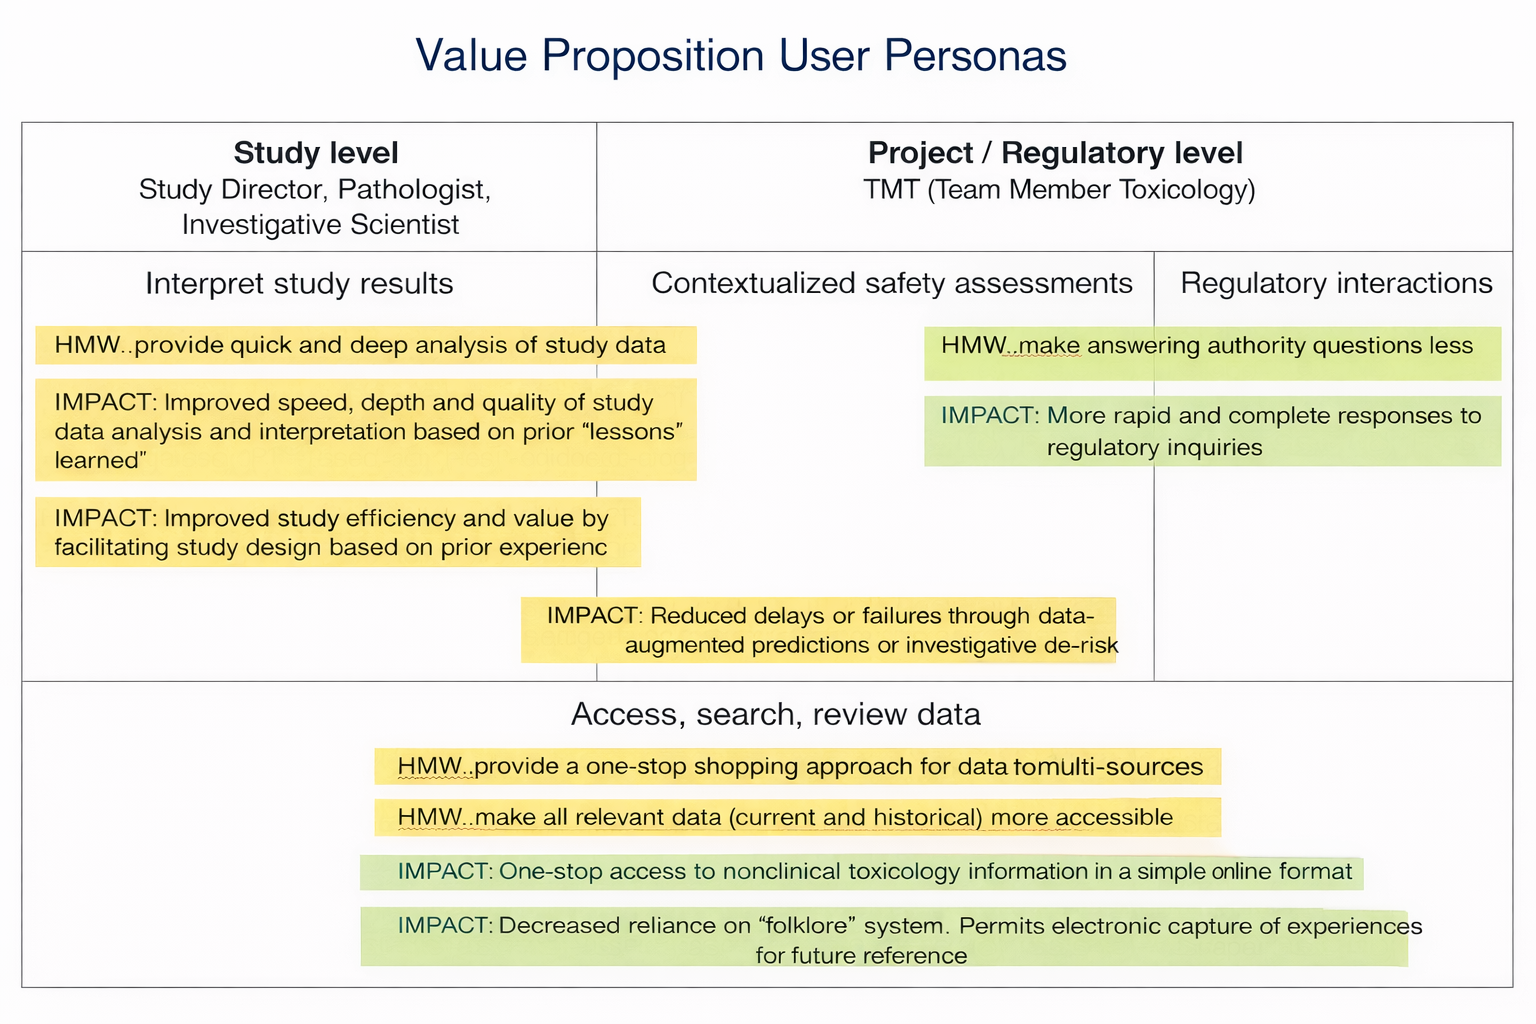
Anticipated Value Proposition
Improved study efficiency and value by facilitating study design based on prior experiences.
Improved speed, depth and quality of data analysis and interpretation from prior “lessons learn”
Reduced delays or failures through data-augmented predictions and investigative de-risking
More rapid and complete responses to regulatory inquiries
Average cost of drug development is $2.6 Billion
70% of toxicity-related failures occur preclinically and are comprised of toxicities for which the preclinical models are predictive of human toxicity
Discovery toxicology should focus on identifying ‘predictable’ toxicities before nominating a development candidate
A 10% improvement in avoiding delay before the initiation of clinical trials could save $90M in development costs per drug
A 10% improvement in predicting failure before the initiation of clinical trials could save $140M in development costs per drug
Business Goals & Success
A unified platform connecting all safety data to enable study design, advanced analysis, regulatory alignment, and predictive toxicology.
Primary goals
Accelerate risk assessment workflows
Improve accuracy of safety signal detection
KPIs desired success
↓ Time-to-insight (target: -30%+)
↑ Task completion efficiency
↑ User confidence in decision-making
↑ Adoption across safety teams

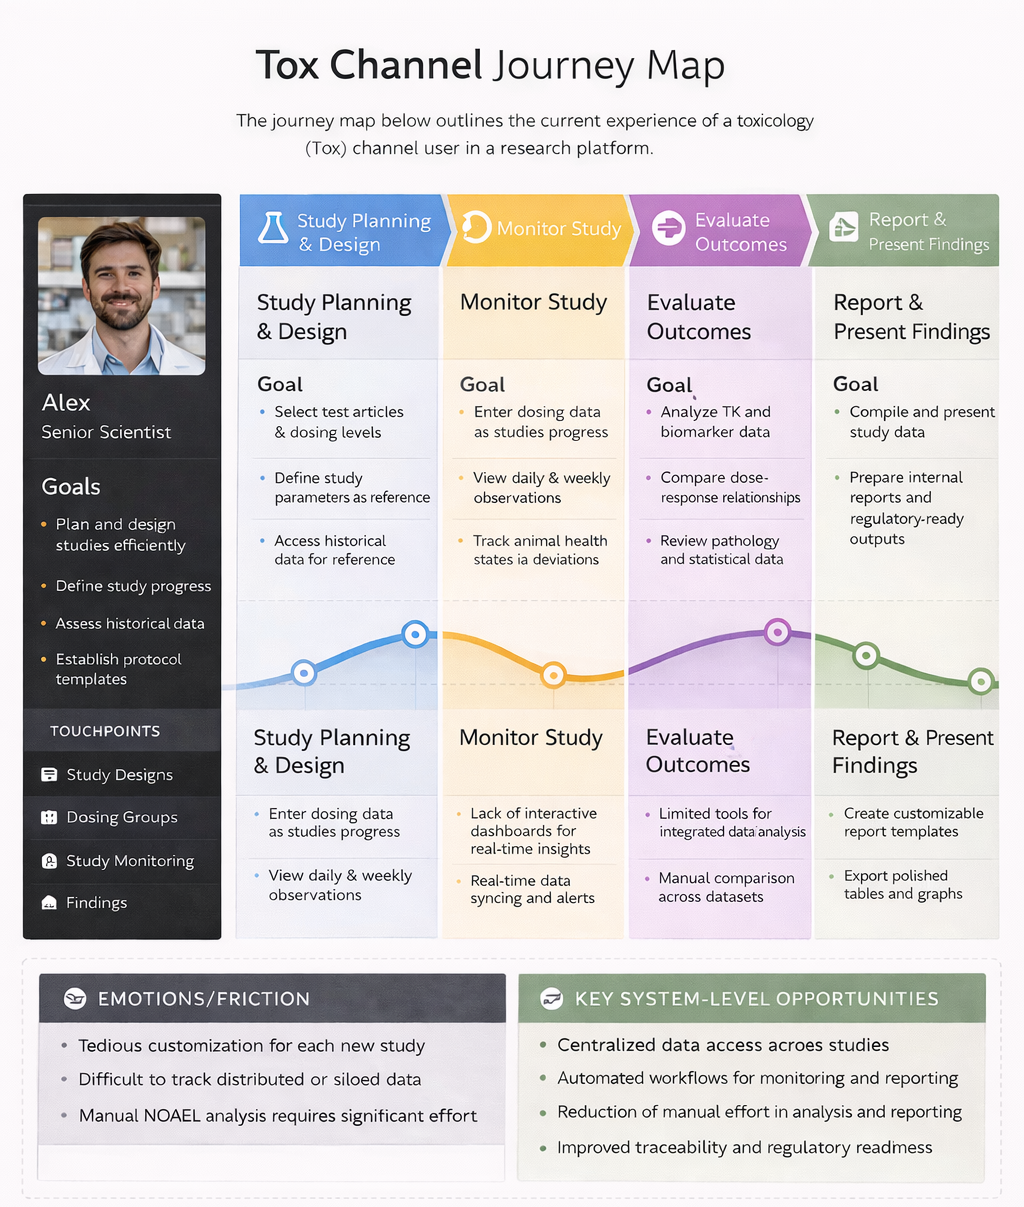
Research & Discovery
Understand how non-clinical scientists analyze drug safety data
Conducted stakeholder interviews with toxicologists and pharmacologists, mapped current-state workflows, and reviewed key artifacts including study reports, toxicology summaries, spreadsheets, and usability testing (iterative validation).
Key Observation
Critical insights were buried across disconnected systems, forcing users to mentally reconcile data.
Opportunity Definition
How Might We
Simplify multi-variable toxicology comparisons?
Surface high-risk signals instantly?
Reduce cognitive burden in complex datasets?
Prioritization
Focused on high-impact, high-frequency workflows:
Study comparison
Signal detection
Data filtering
Scientists relied on fragmented systems and manual workflows to analyze toxicology data, limiting their ability to detect adverse effects efficiently and scale insights for predictive modeling.
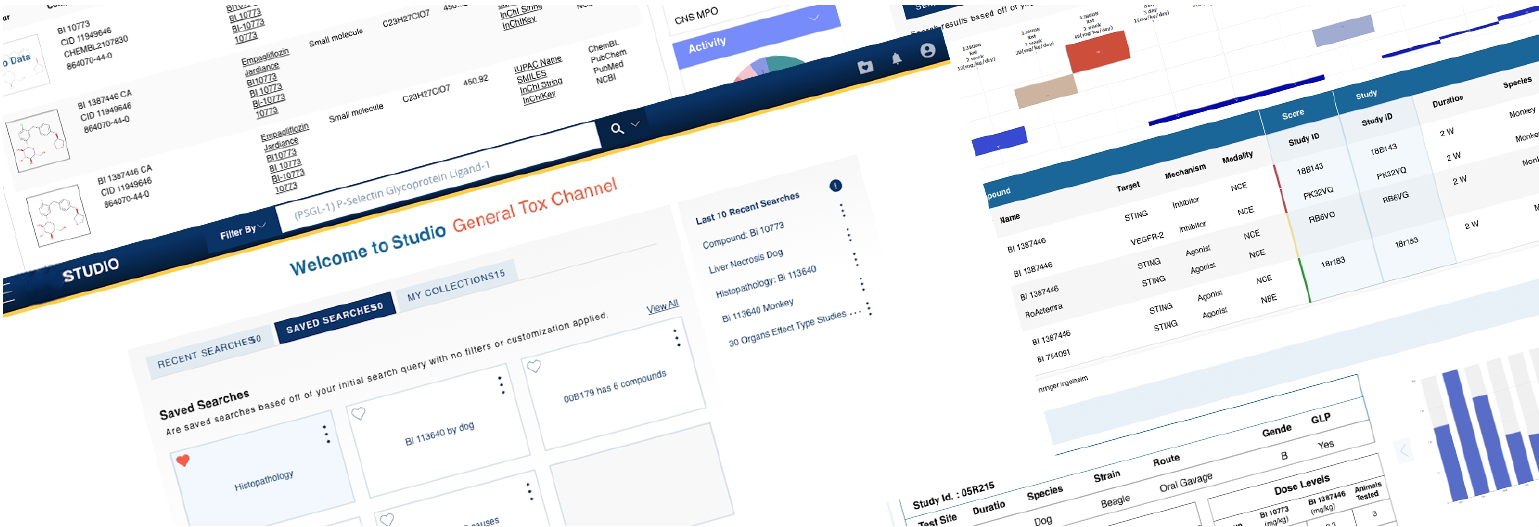
From fragmented research to unified insight.
Problem → Insight → Solution storyboard
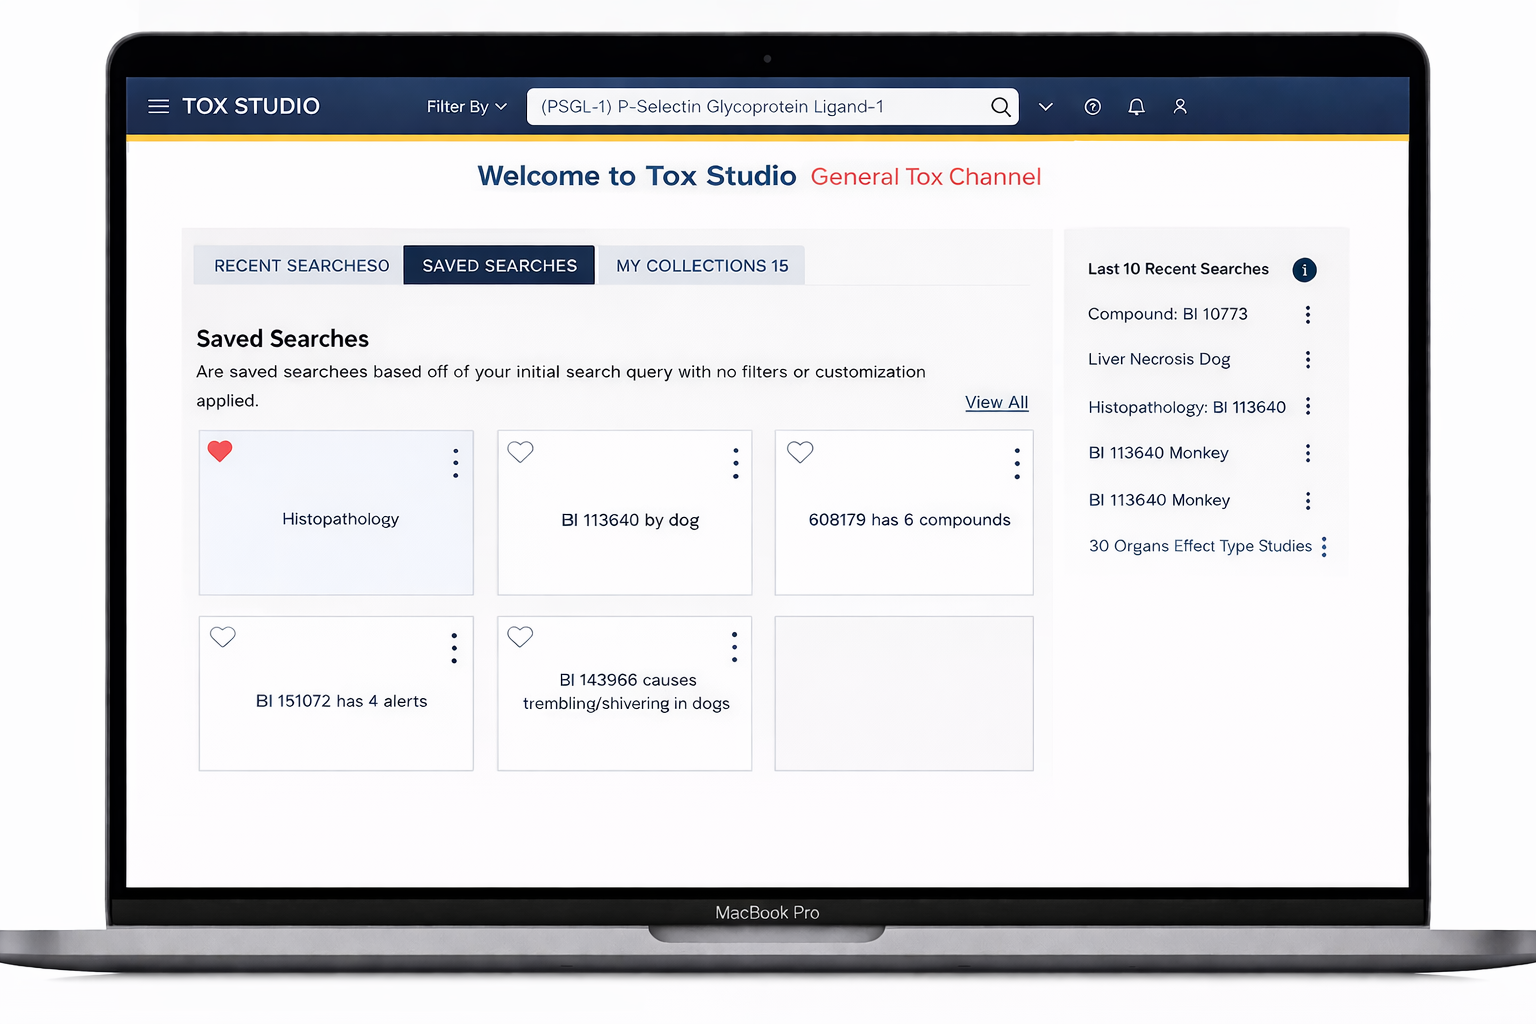
The ability to searches complex sequences including recent and saved

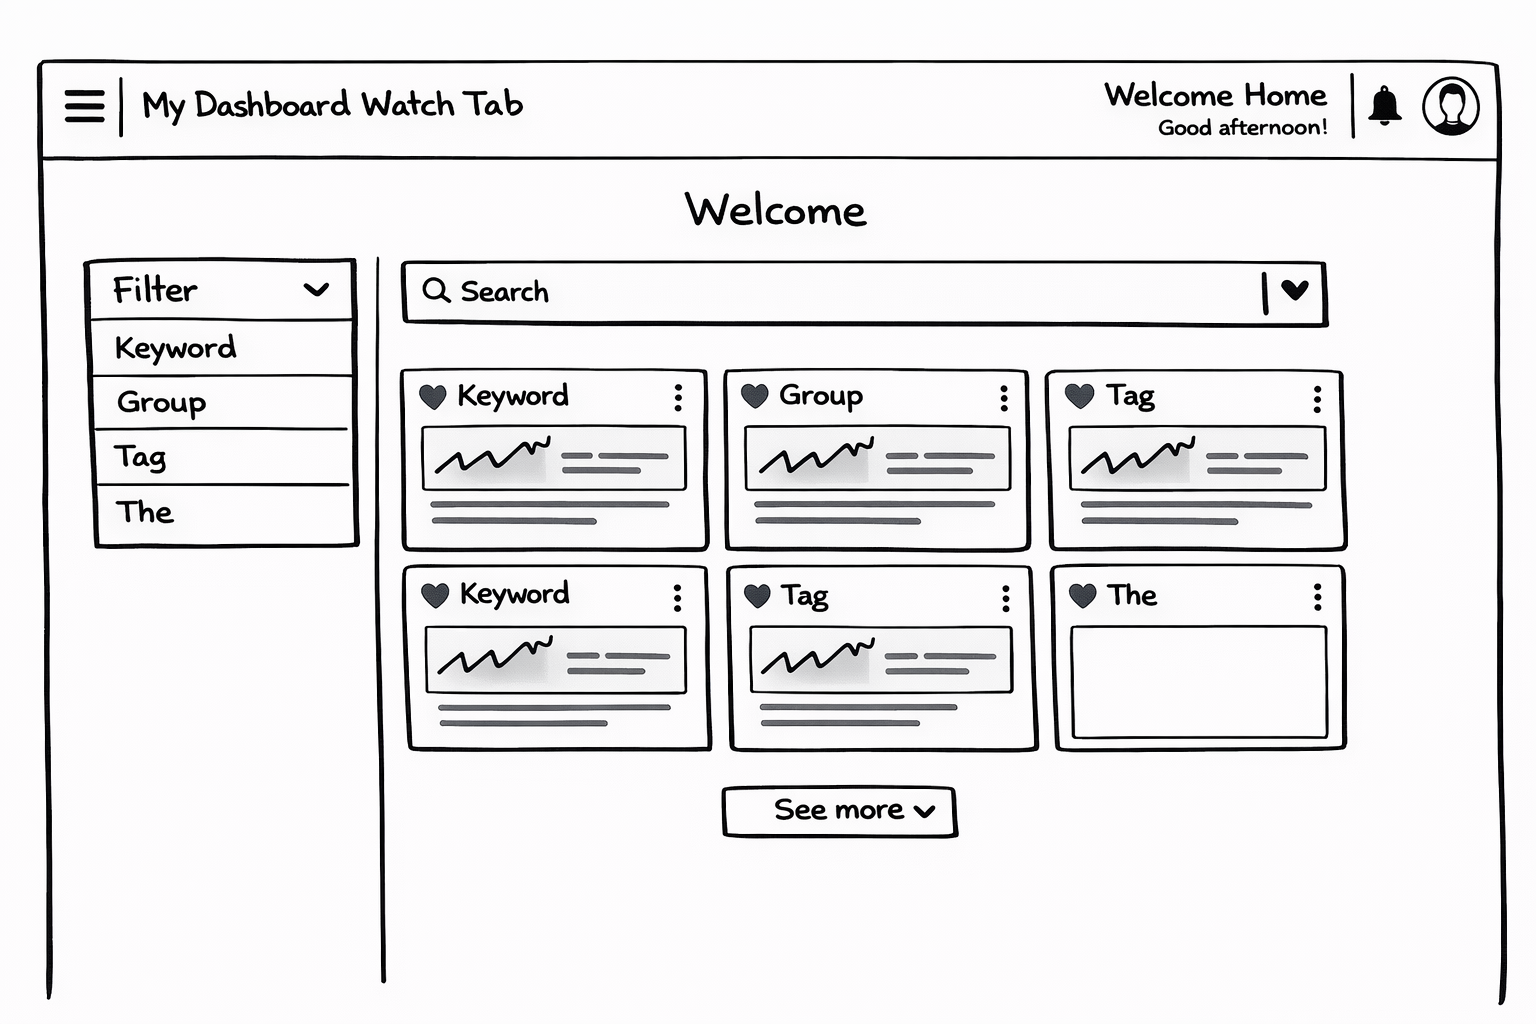
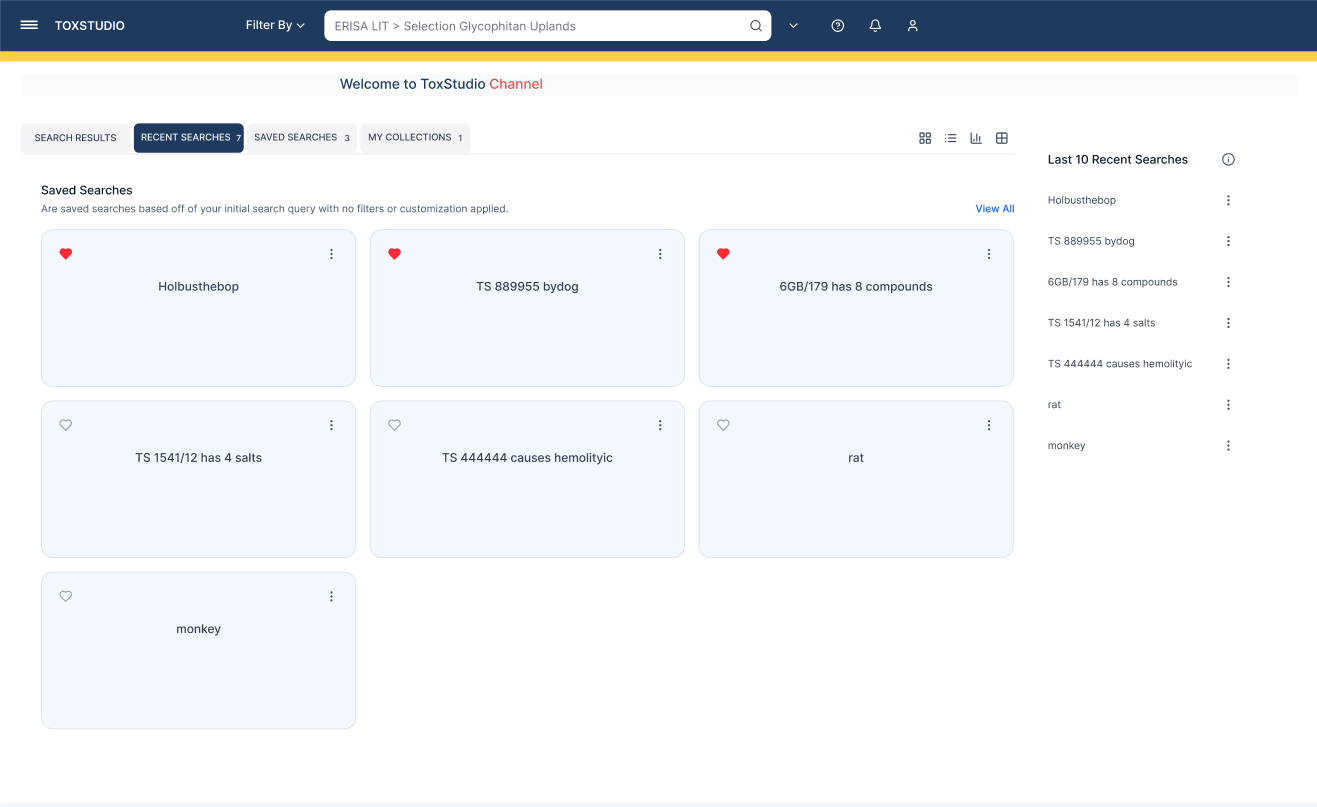
Users immediately engage with relevant studies results without confusion
“We defined success not just in usability, but in how effectively the system structures data for machine learning and improves early risk detection.”
Goals
Design a centralized, intelligent platform that:
Enables rapid exploration of toxicology data
Supports read-across analysis
Reduces risk through data-driven insights
Lays the foundation for machine learning prediction models
Defining the Problem
Non-clinical scientists lack a unified, efficient way to compare studies and detect adverse signals across fragmented datasets.
Design Opportunity:
Make comparison the primary interaction model
Reduce cognitive load in multi-variable analysis
Structure data for AI/ML readiness
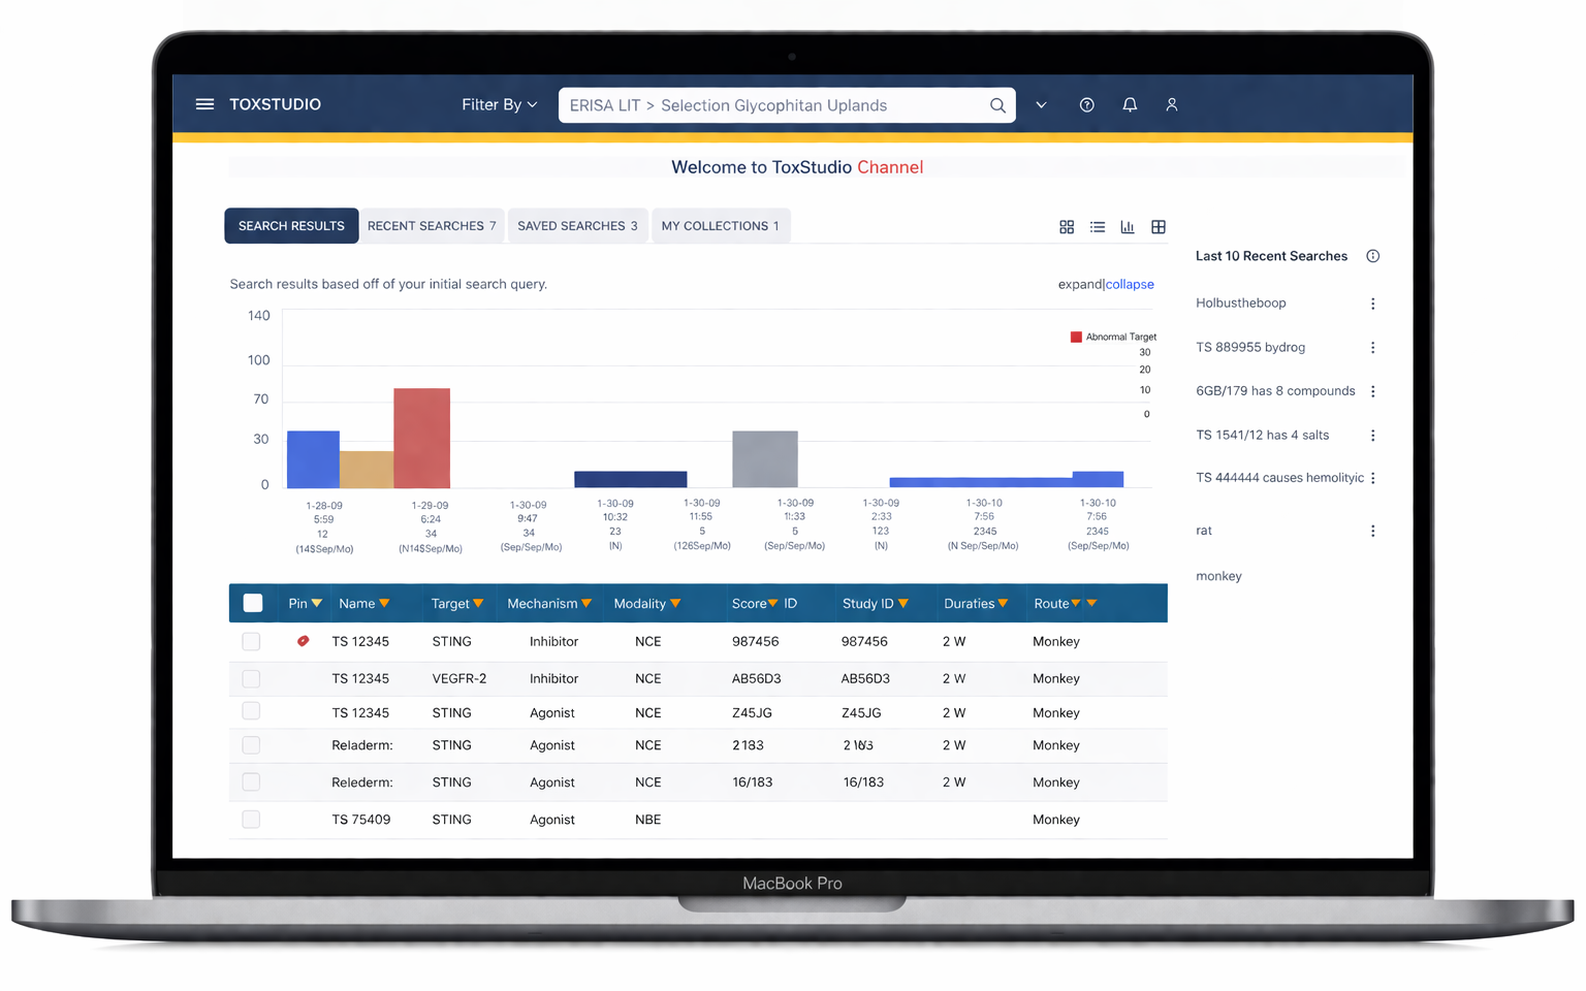
Solution Summary
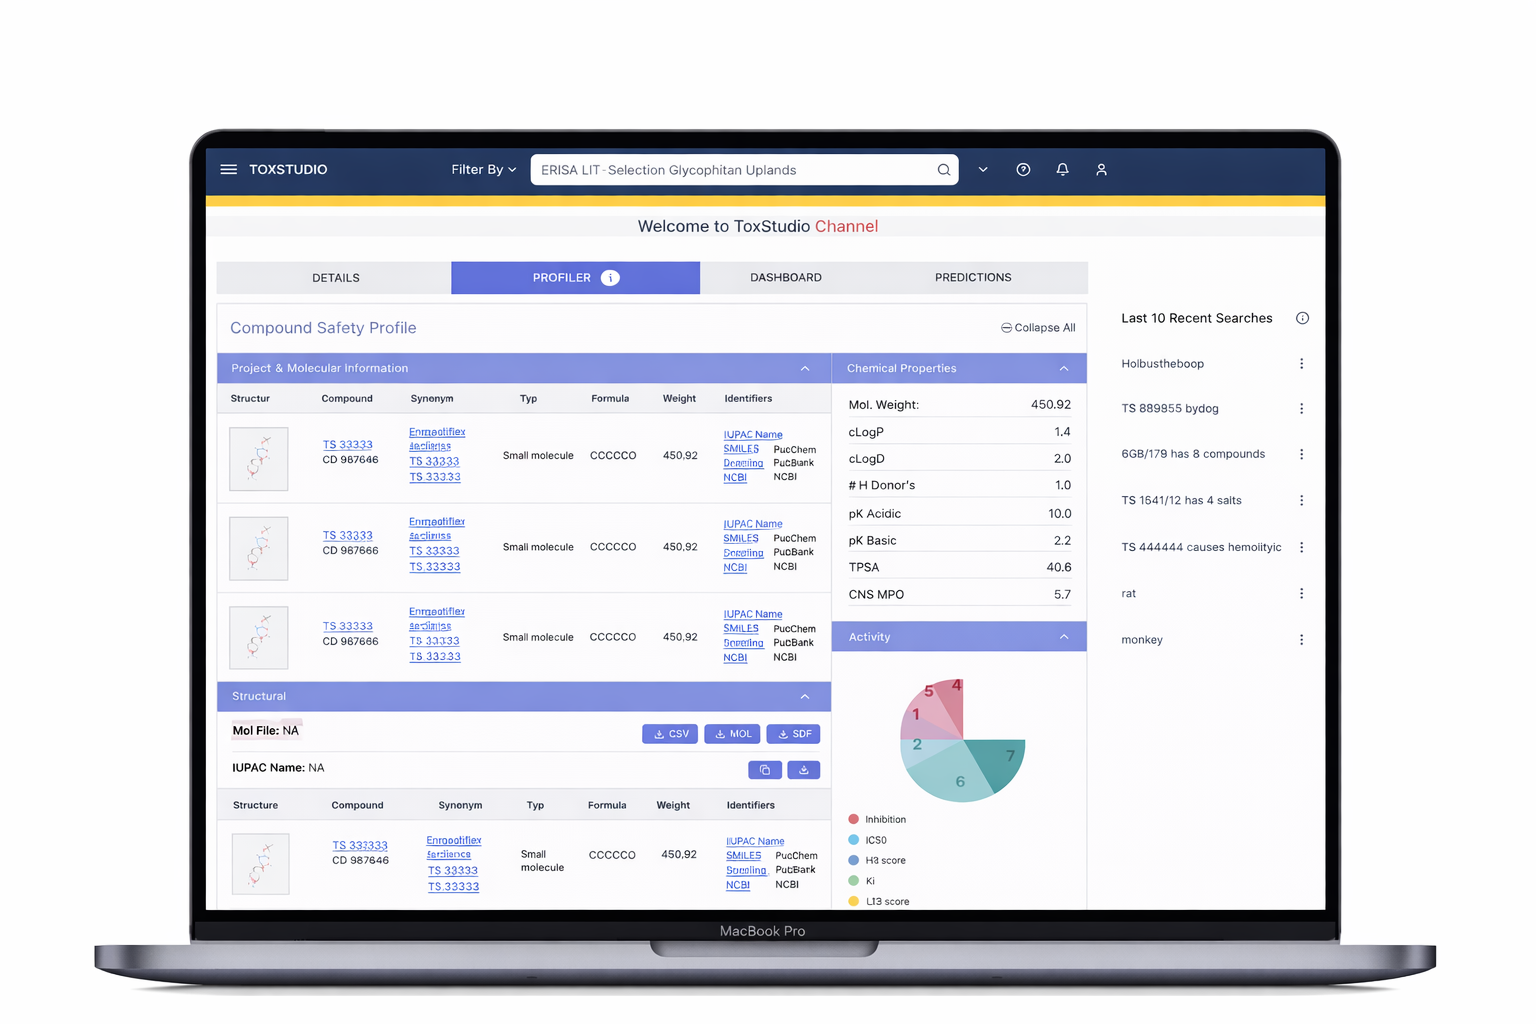
Designed a centralized platform enabling:
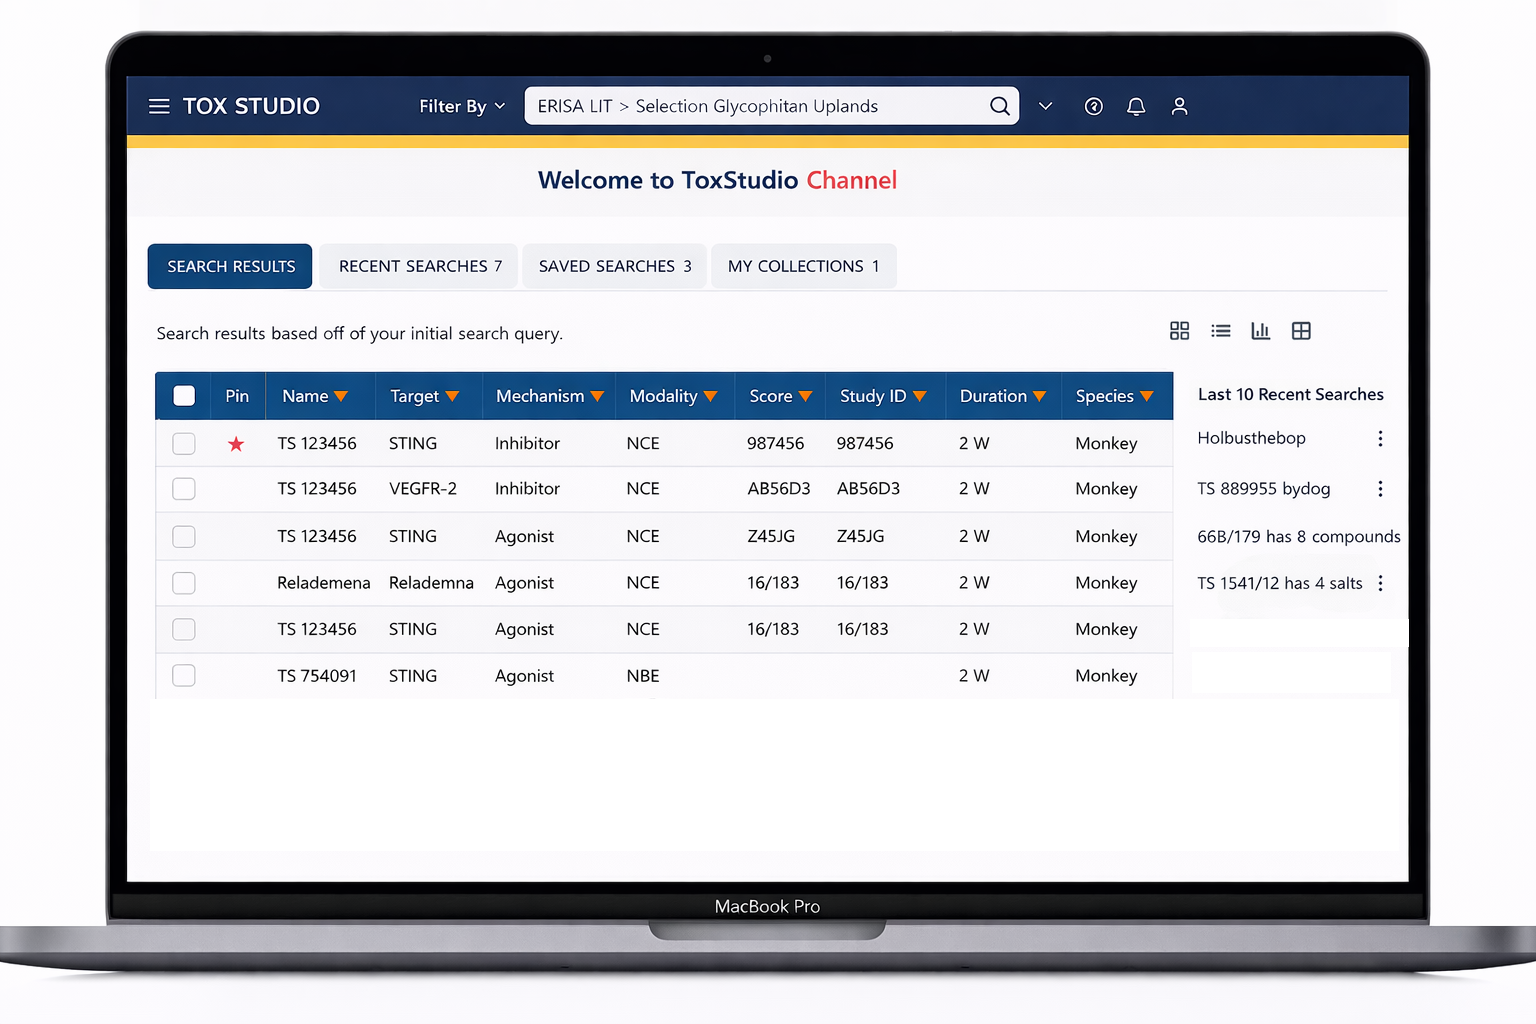
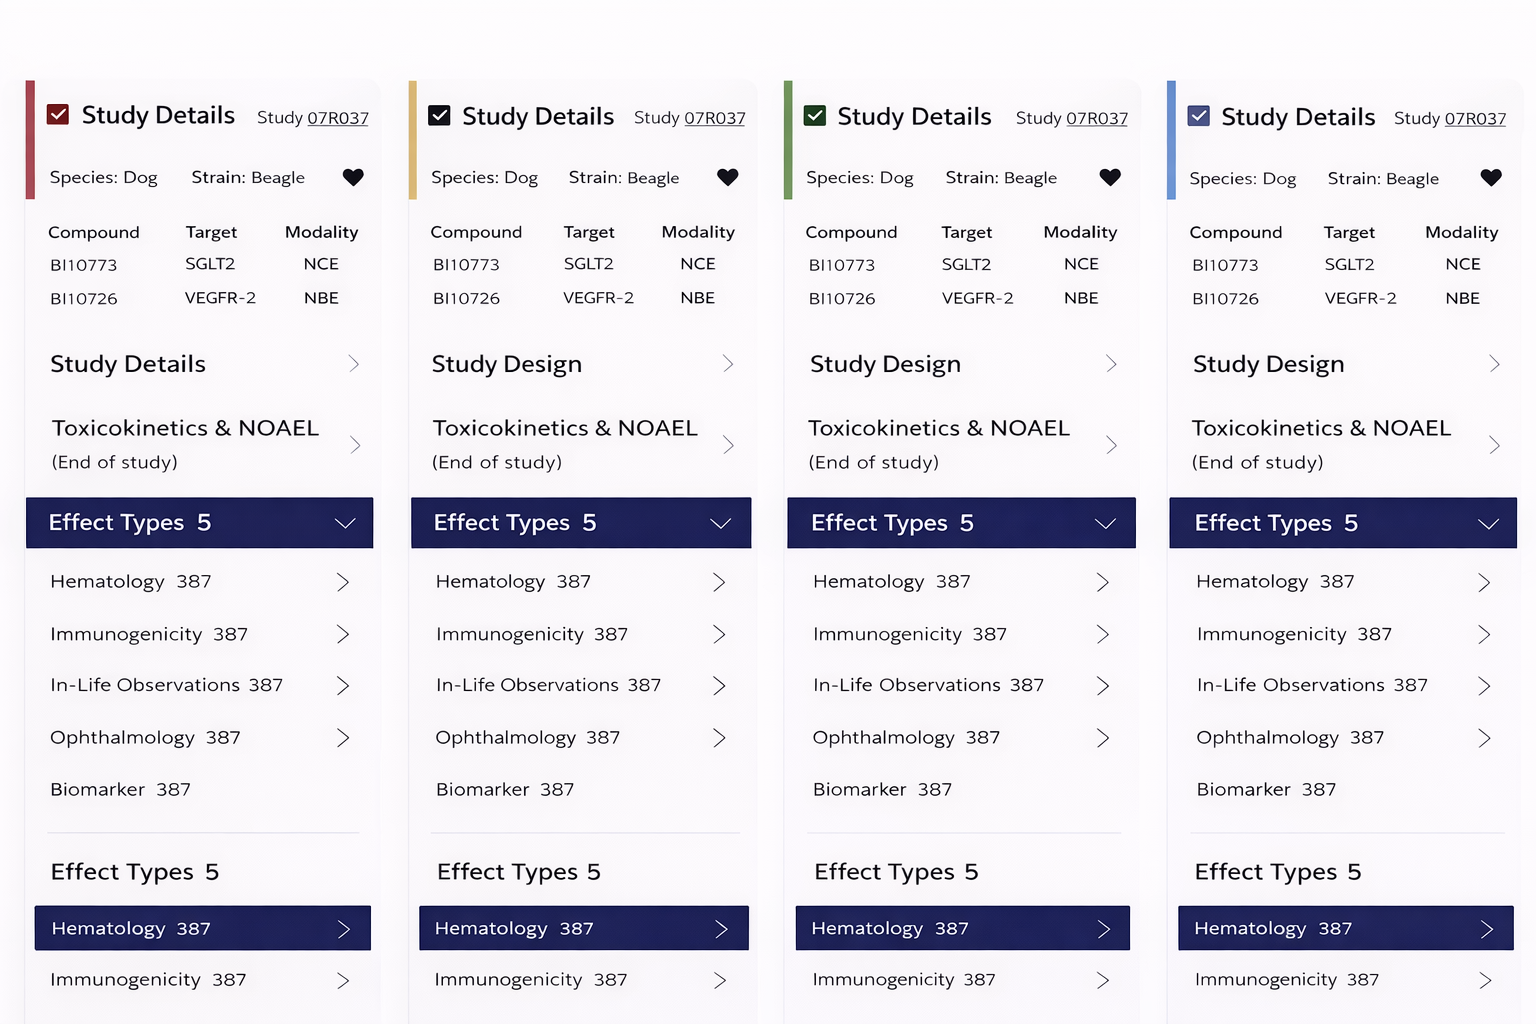
Multi-dimensional search (compound, species, modality)
Side-by-side study comparison (read-across analysis)
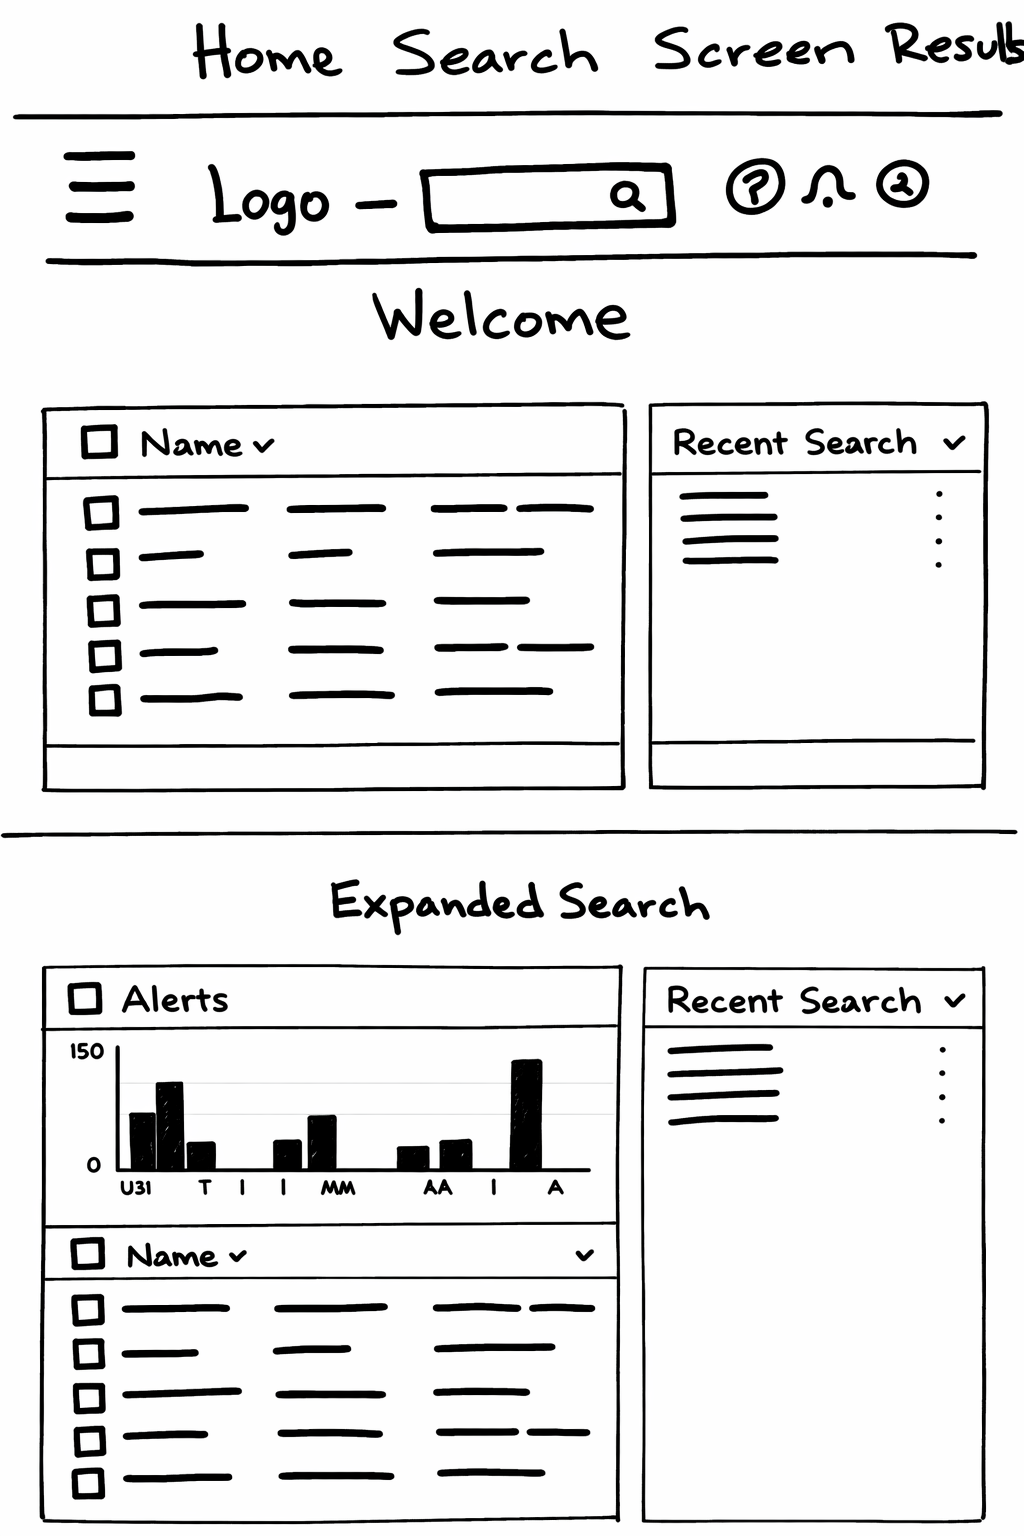
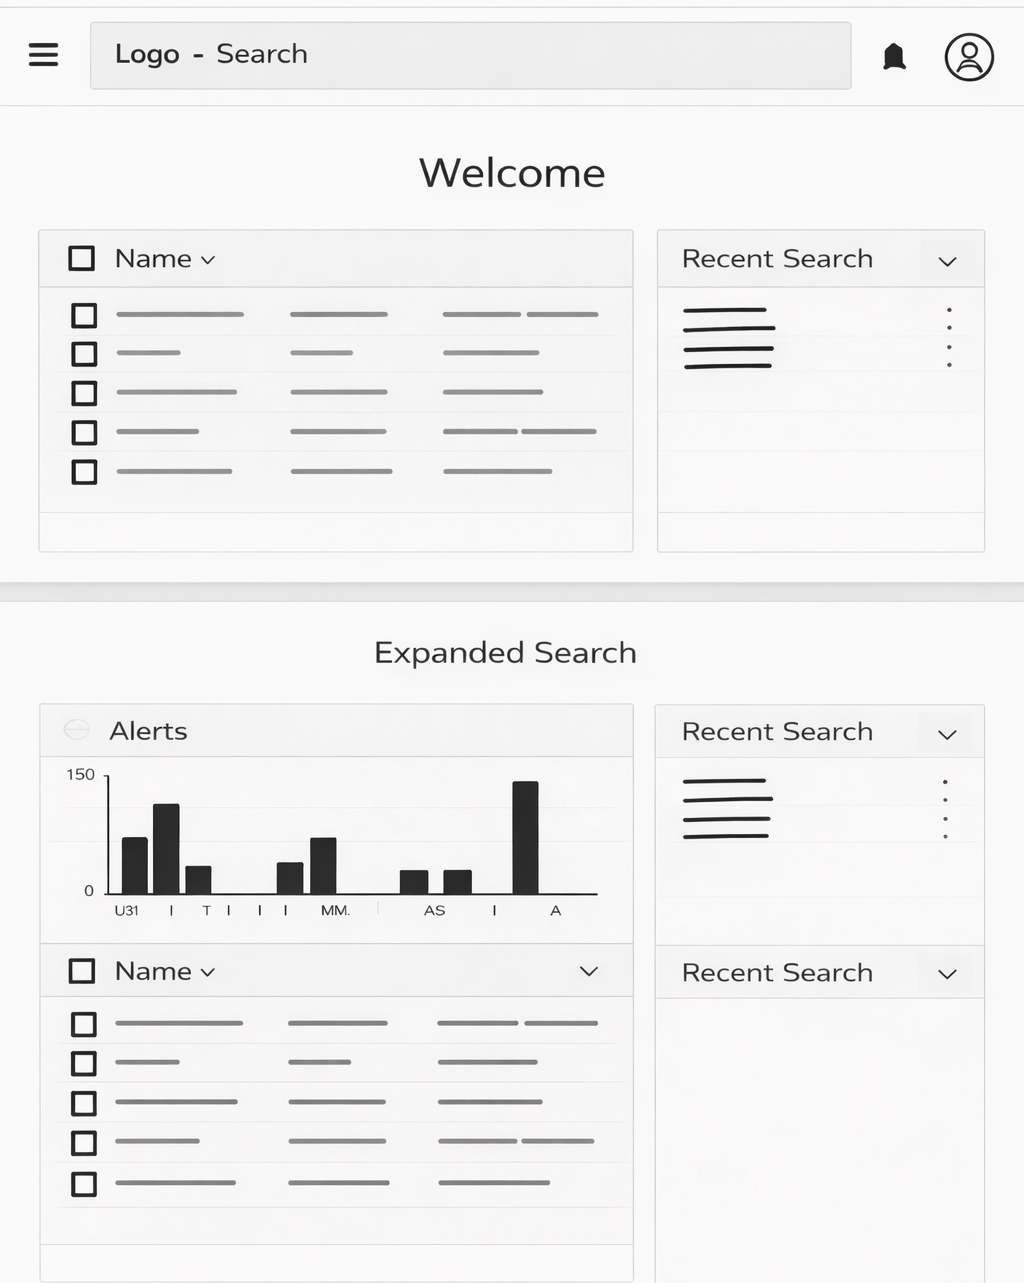
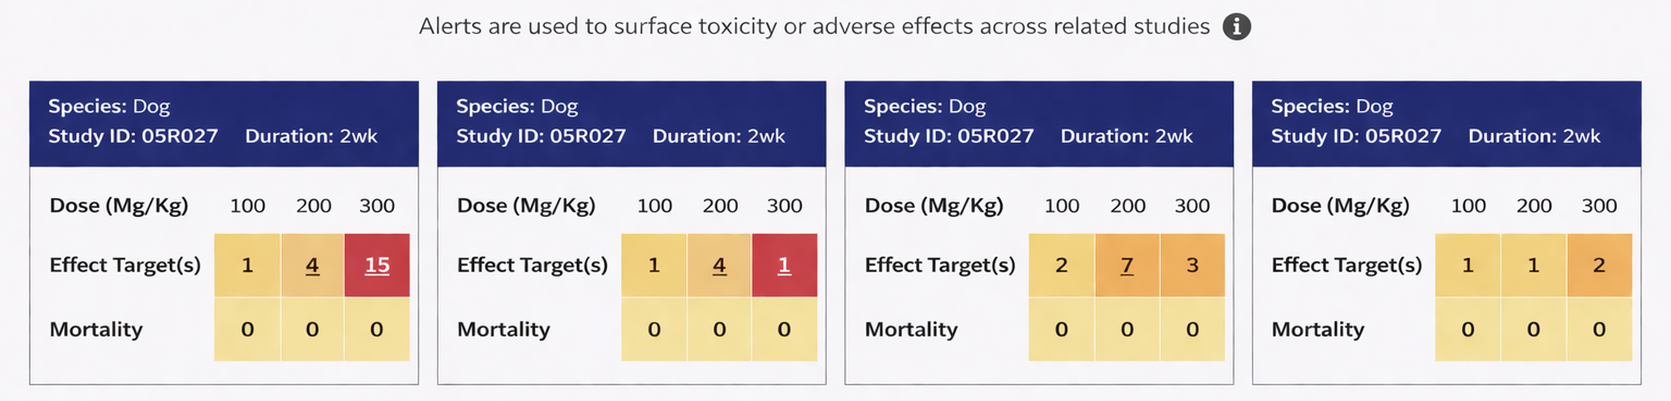
Visual risk detection (heatmap alerts)
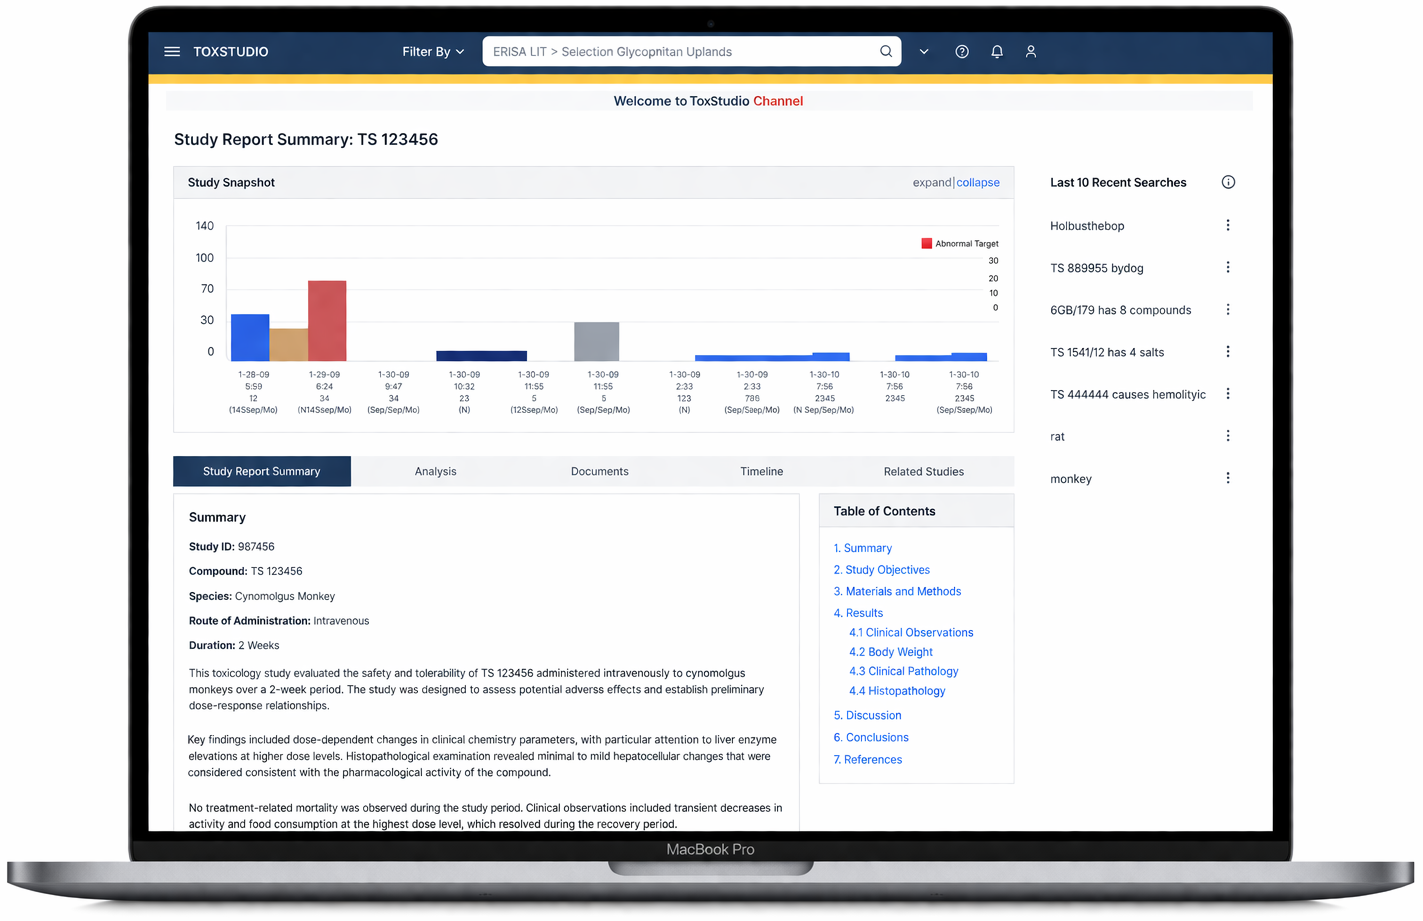
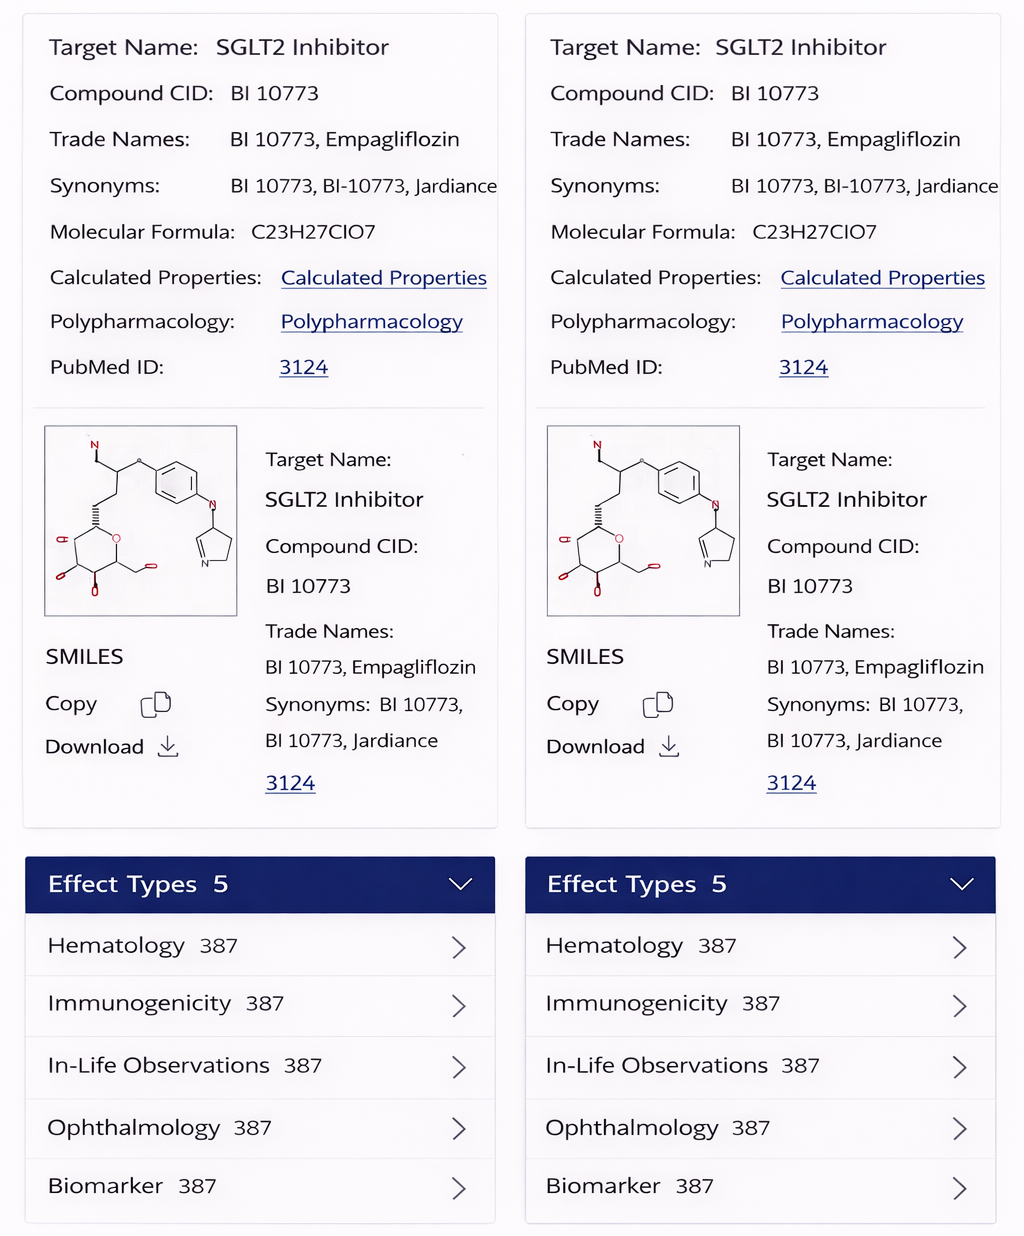
Deep access to toxicology data (NOAEL, histopathology, PK)
Customizable user-driven views
Comparison-first workflows that improve decision-making and generate predictive machine learning–ready insights.
Key features
The system enables customized views tailored to diverse non-clinical roles, including toxicologists, pharmacologists, and research scientists.
Design Execution
Core UX Decisions
Side-by-side comparison interface for multi-study analysis
Heatmap overlays to highlight anomalies
Progressive disclosure to manage complexity
Filtering system to reduce dataset noise
System Thinking
Modular components for scalability
Designed for integration with ML outputs
Prototyping & Validation
Test Variants
Comparison layouts (table vs side-by-side)
Signal representation (heatmap vs text)
Filtering complexity levels
Results
Side-by-side comparison → faster task completion
Heatmaps → improved signal detection speed
Filtering → effective but required guided defaults
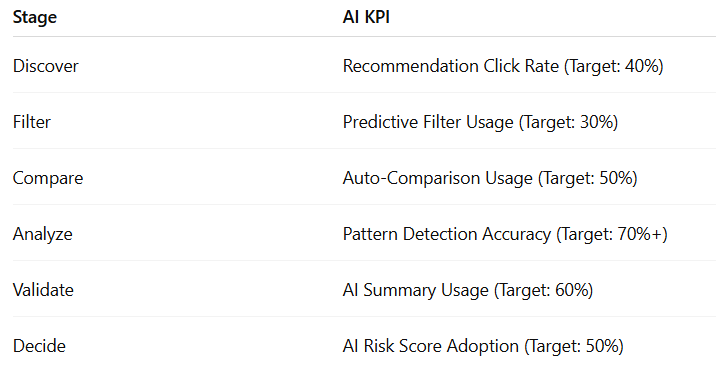
“We aligned KPIs to each stage of the user journey to ensure we weren’t just improving usability, but accelerating decision-making and generating structured data for machine learning.”
Impact
By centralizing research inputs and integrating predictive modeling, the platform reduces cognitive load and eliminates redundant steps. Users can access compound data, target insights, structural alerts, and predictive visualizations in one place—enabling faster discovery, more accurate analysis, and more confident decision-making.
KPI Metrics
Time to Insight (TTI): ↓ 50%
End-to-End Task Success Rate: 90%+
User Retention (Weekly Active Users): +35%
ML-Ready Data Growth: 2–3x