< Back Case Study | BioTech
Nonclinical Drug Safety Platform
Project Overview
Client: Boehringer Ingelheim
Industry: Pharma
Platform: Web, Tablet
Focus: Risk assessment, trending, historical data & personalization
Nonclinical drug safety platform
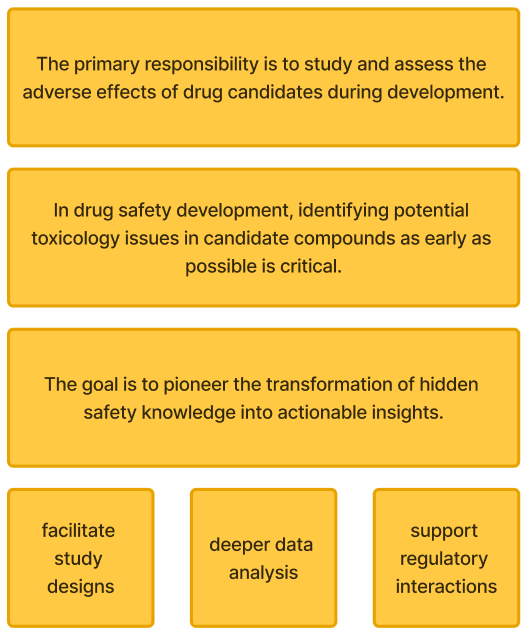
Transforming hidden safety knowledge into insights
Facilitate study designs, deeper data analysis, regulatory interactions
Enhance investigative de-risking
Support predictive toxicology models
Users:
Key users include pathologists, toxicologists, and discovery researchers.
In drug safety development, identifying potential toxicology issues in candidate compounds as early as possible is critical.

Project Summary
Role: Senior Product Designer (UX + Research)
Scope: End-to-end (Discovery → MVP)
Environment: Pharmaceutical R&D / Non-clinical drug safety
Timeline: ~12 months
Impact (Topline)
95% of users would recommend the platform
Reduced manual comparison time by ~40%
Improved signal detection speed (qualitative + behavioral validation)
Every $1 that an organization invests in user experience results in a return of $100. That’s an ROI of 9,900%!
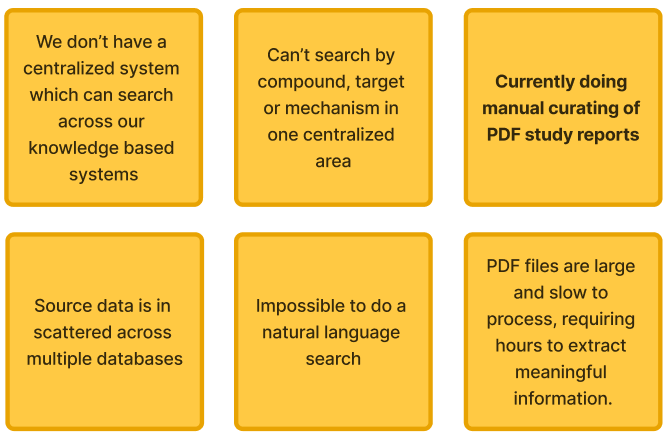
The problem
Business Problem: Drug safety teams relied on fragmented datasets (tox reports, spreadsheets, legacy systems), slowing risk assessment and increasing decision latency in critical R&D phases.
User Problem: Manual cross-study comparison High cognitive load interpreting complex toxicology data Lack of unified, visualized insights
Why It Matters: Delayed or missed safety signals directly impact:
Drug development timelines
Regulatory risk
Patient safety outcomes
Goals & Success
Business Problem: Drug safety teams relied on fragmented datasets (tox reports, spreadsheets, legacy systems), slowing risk assessment and increasing decision latency in critical R&D phases.
Primary Goals
Accelerate risk assessment workflows
Improve accuracy of safety signal detection
KPIs
↓ Time-to-insight (target: -30%+)
↑ Task completion efficiency
↑ User confidence in decision-making
↑ Adoption across safety teams

Discovery
Methods: Understand how non-clinical scientists analyze drug safety data
Conducted stakeholder interviews with pharmacologists, toxicologists and research scientist, mapped current-state workflows, and reviewed key artifacts including study reports, toxicology summaries, spreadsheets, and usability testing (iterative validation).
Key Observation
Critical insights were buried across disconnected systems, forcing users to mentally reconcile data.
User Modeling
Toxicologist
Goal: Identify adverse effects quickly
Pain: Manual comparisons
Pharmacologist
Goal: Correlate mechanism + toxicity
Pain: Disconnected datasets
Research Scientist
Goal: Simplify interpretation
Pain: High cognitive load
User Modeling
Toxicologist
Needs: Rapid adverse effect detection
Pain: Manual cross-study comparison
Goal: Fast risk assessment
Pharmacologist
Needs: Understand compound behavior
Pain: Disconnected pharmacology and tox data
Goal: Correlate mechanism with toxicity
Research Scientist
Needs: Clear interpretation of complex data
Pain: High cognitive load
Goal: Simplified, guided exploration
Opportunity Definition
How Might We
Simplify multi-variable toxicology comparisons?
Surface high-risk signals instantly?
Reduce cognitive burden in complex datasets?
Prioritization
Focused on high-impact, high-frequency workflows:
Study comparison
Signal detection
Data filtering
Research & Discovery
Methods: Understand how non-clinical scientists analyze drug safety data
Conducted stakeholder interviews with toxicologists and pharmacologists, mapped current-state workflows, and reviewed key artifacts including study reports, toxicology summaries, spreadsheets, and Usability testing (iterative validation).
Methods
Stakeholder interviews (toxicologists, pharmacologists, SMEs)
Workflow mapping (current-state analysis)
Artifact review (tox reports, summaries, spreadsheets)
Usability testing (iterative validation)
Key Observation
Critical insights were buried across disconnected systems, forcing users to mentally reconcile data.
Non-clinical scientists relied on fragmented systems and manual workflows to analyze toxicology data, limiting their ability to detect adverse effects efficiently and scale insights for predictive modeling.
Slower safety assessments
Increased risk of missed adverse signals
Inefficient research workflows.
“We defined success not just in usability, but in how effectively the system structures data for machine learning and improves early risk detection.”
Project Goals
Design a centralized, intelligent platform that:
Enables rapid exploration of toxicology data
Supports read-across analysis
Reduces risk through data-driven insights
Lays the foundation for machine learning prediction models
Defining the Problem
Non-clinical scientists lack a unified, efficient way to compare studies and detect adverse signals across fragmented datasets.
Design Opportunity:
Make comparison the primary interaction model
Reduce cognitive load in multi-variable analysis
Structure data for AI/ML readiness
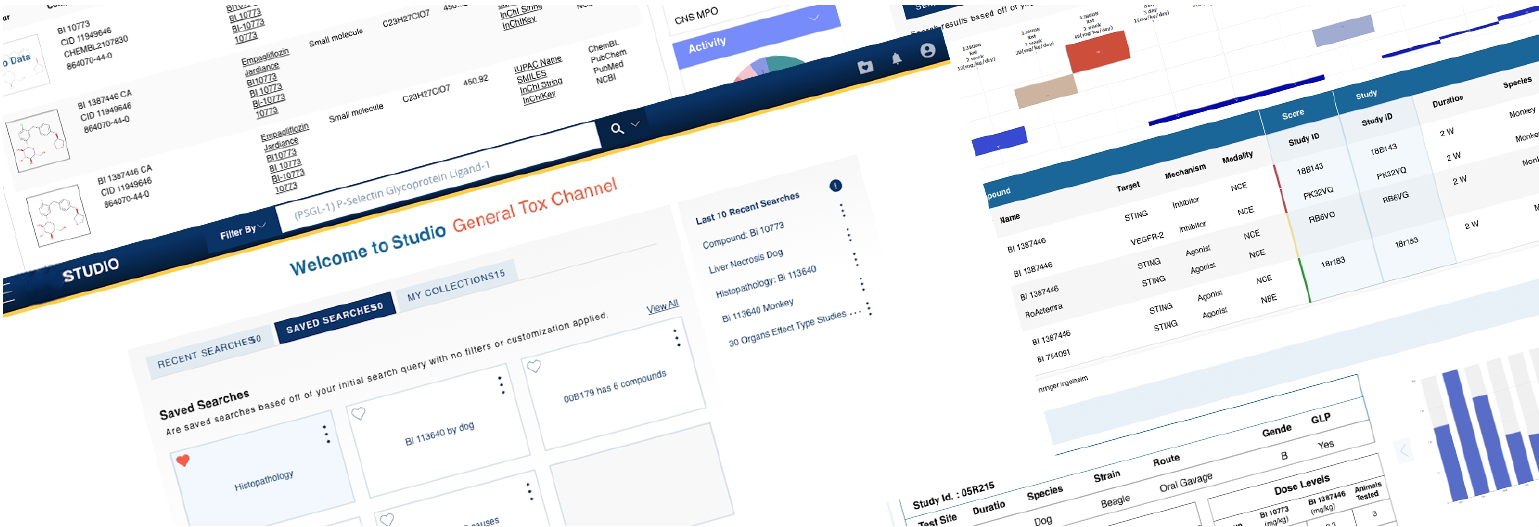
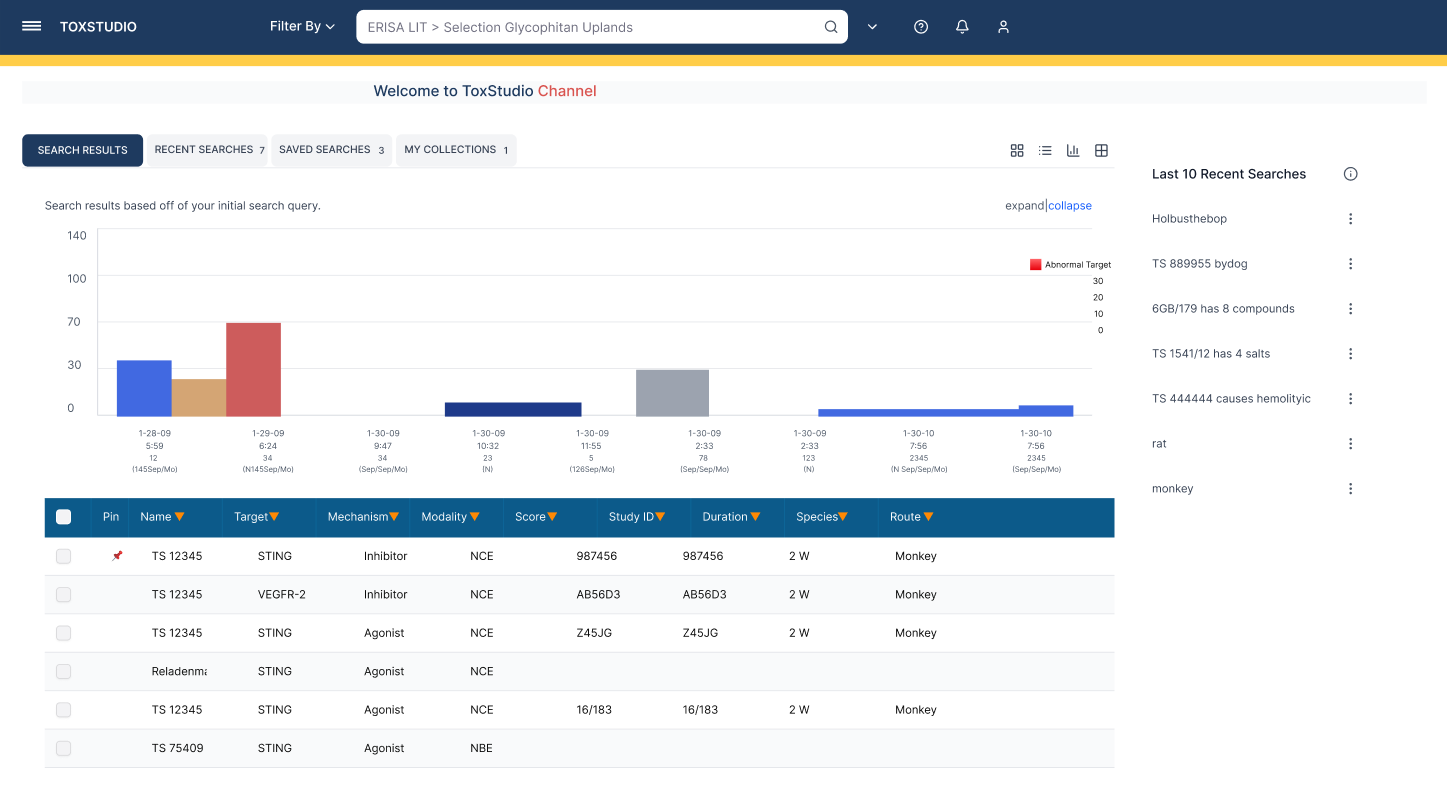
Solution Summary
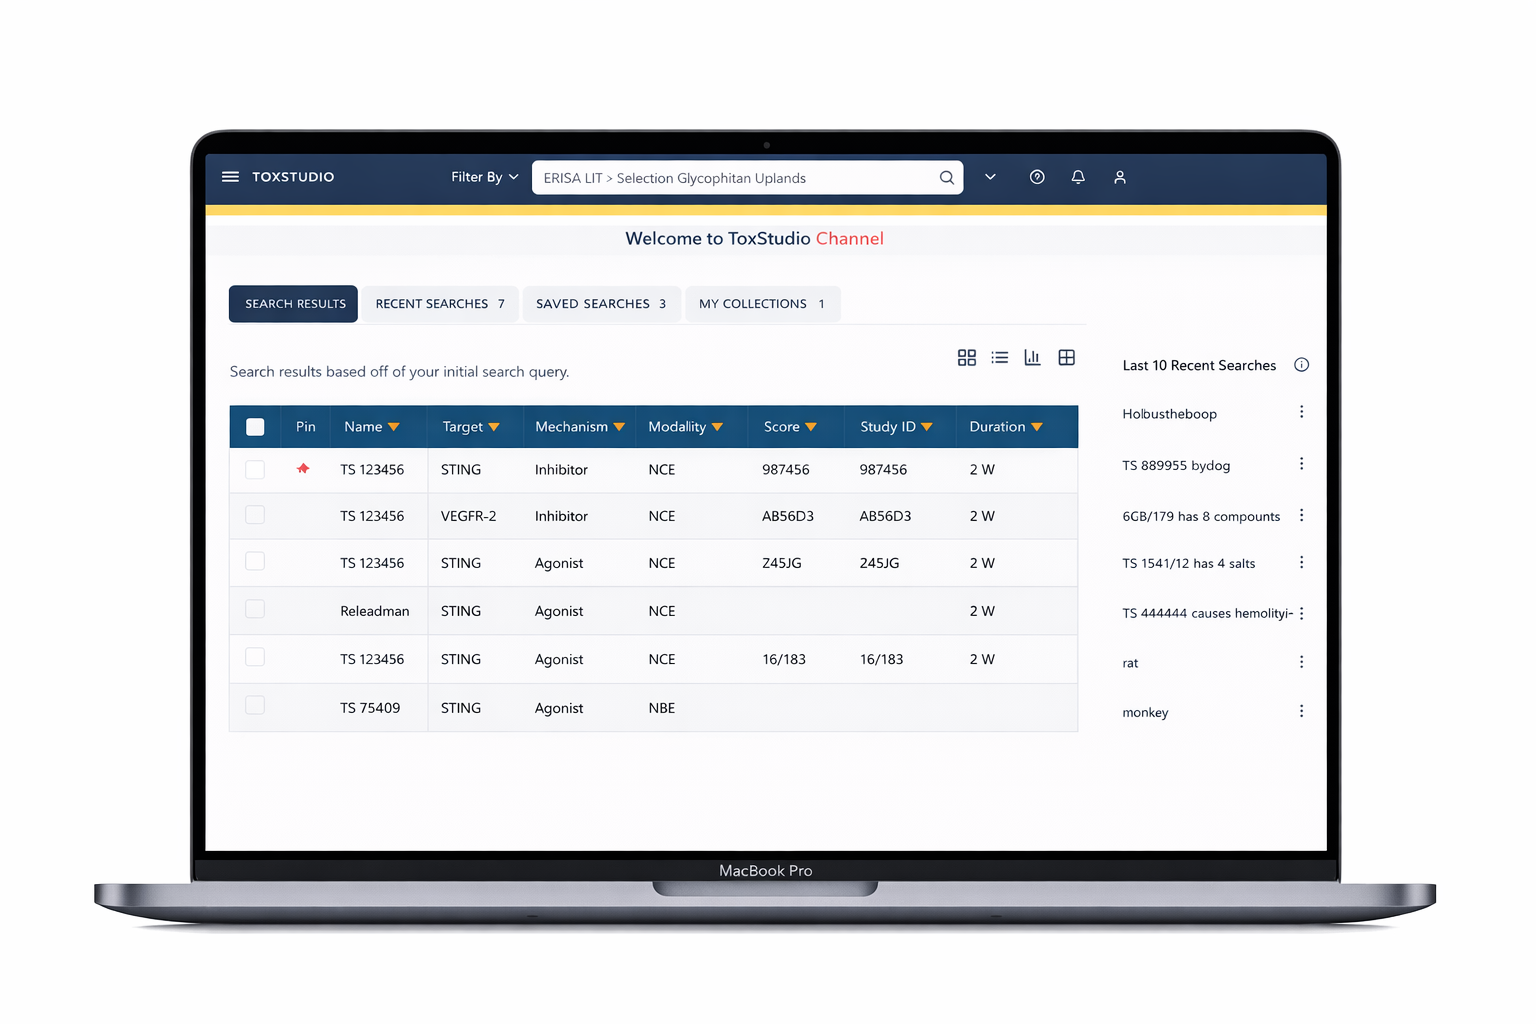
Designed a centralized platform enabling:
Multi-dimensional search (compound, species, modality)
Side-by-side study comparison (read-across analysis)
Visual risk detection (heatmap alerts)
Deep access to toxicology data (NOAEL, histopathology, PK)
Customizable user-driven views
Built using design thinking and user testing to create comparison-first workflows that improve decision-making and generate machine learning–ready insights.
Process strategy
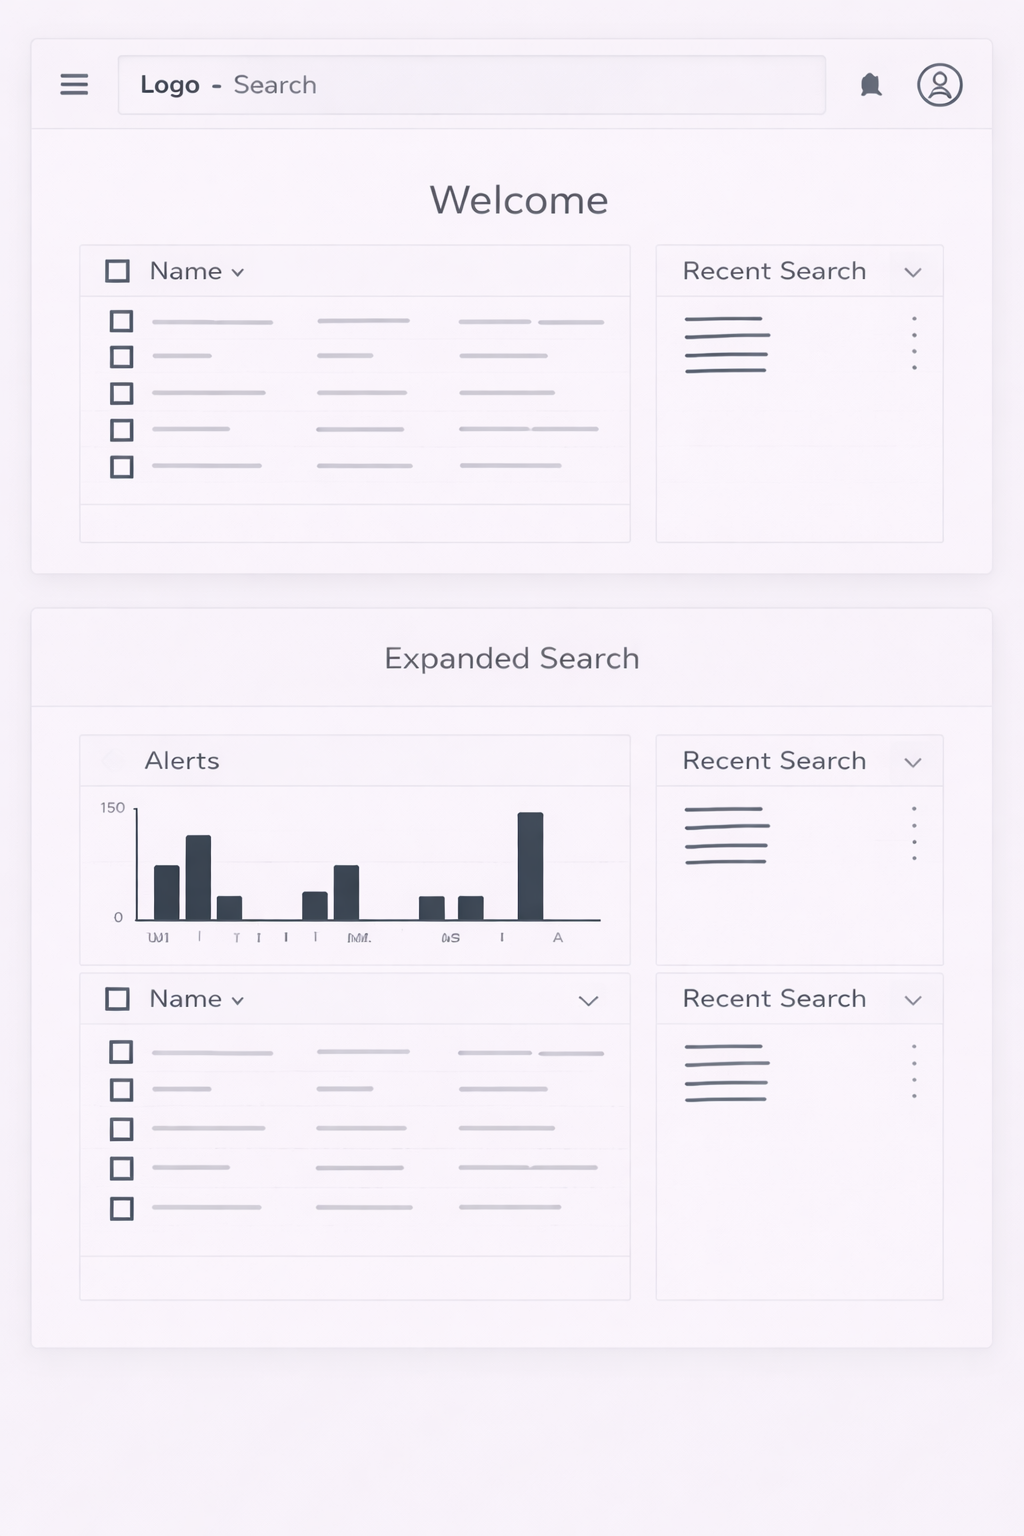
Approached this as a systems design problem by restructuring the information architecture around how analysts think—region, theme, risk type, and time horizon—then designing a Threat Lens dashboard to surface active and emerging risks, introducing advanced filtering and comparison tools to support analysis workflows, and building personalization features so users could track what mattered most.
Key features
Deliver a centralized Threat Lens dashboard for real-time risk visibility, enable multi-dimensional filtering to reduce search friction, provide side-by-side comparison tools to support decision-making, and establish a personal workspace for saving and tracking intelligence.
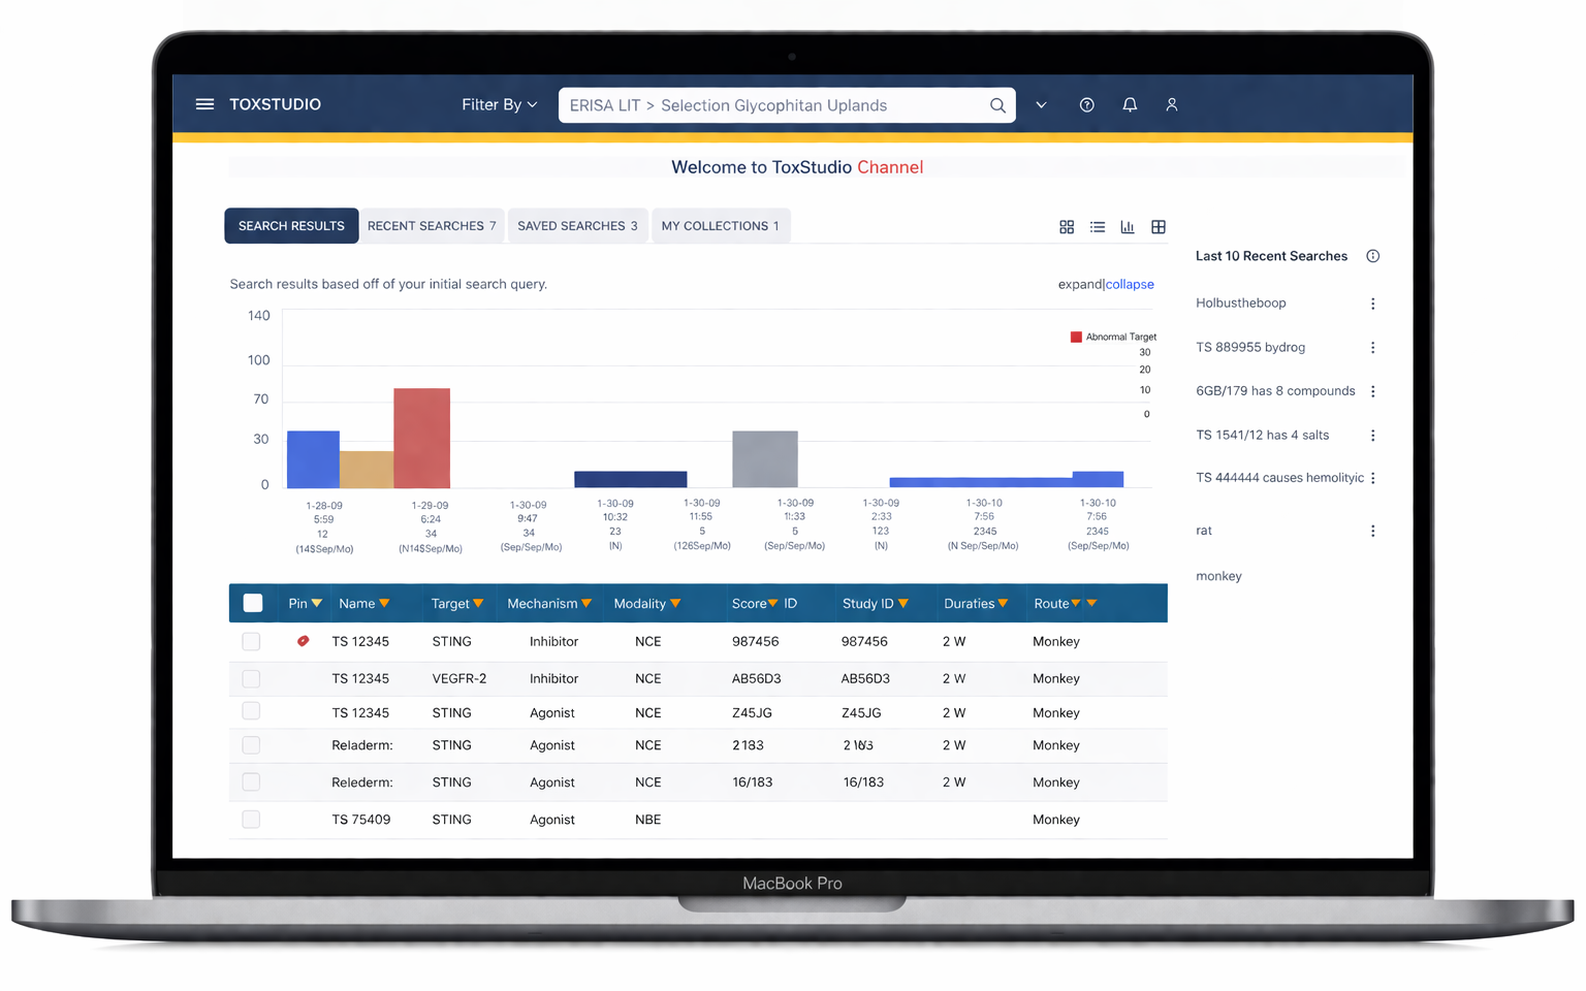
Users immediately engage with relevant studies without confusion
Big ideas, real impact.
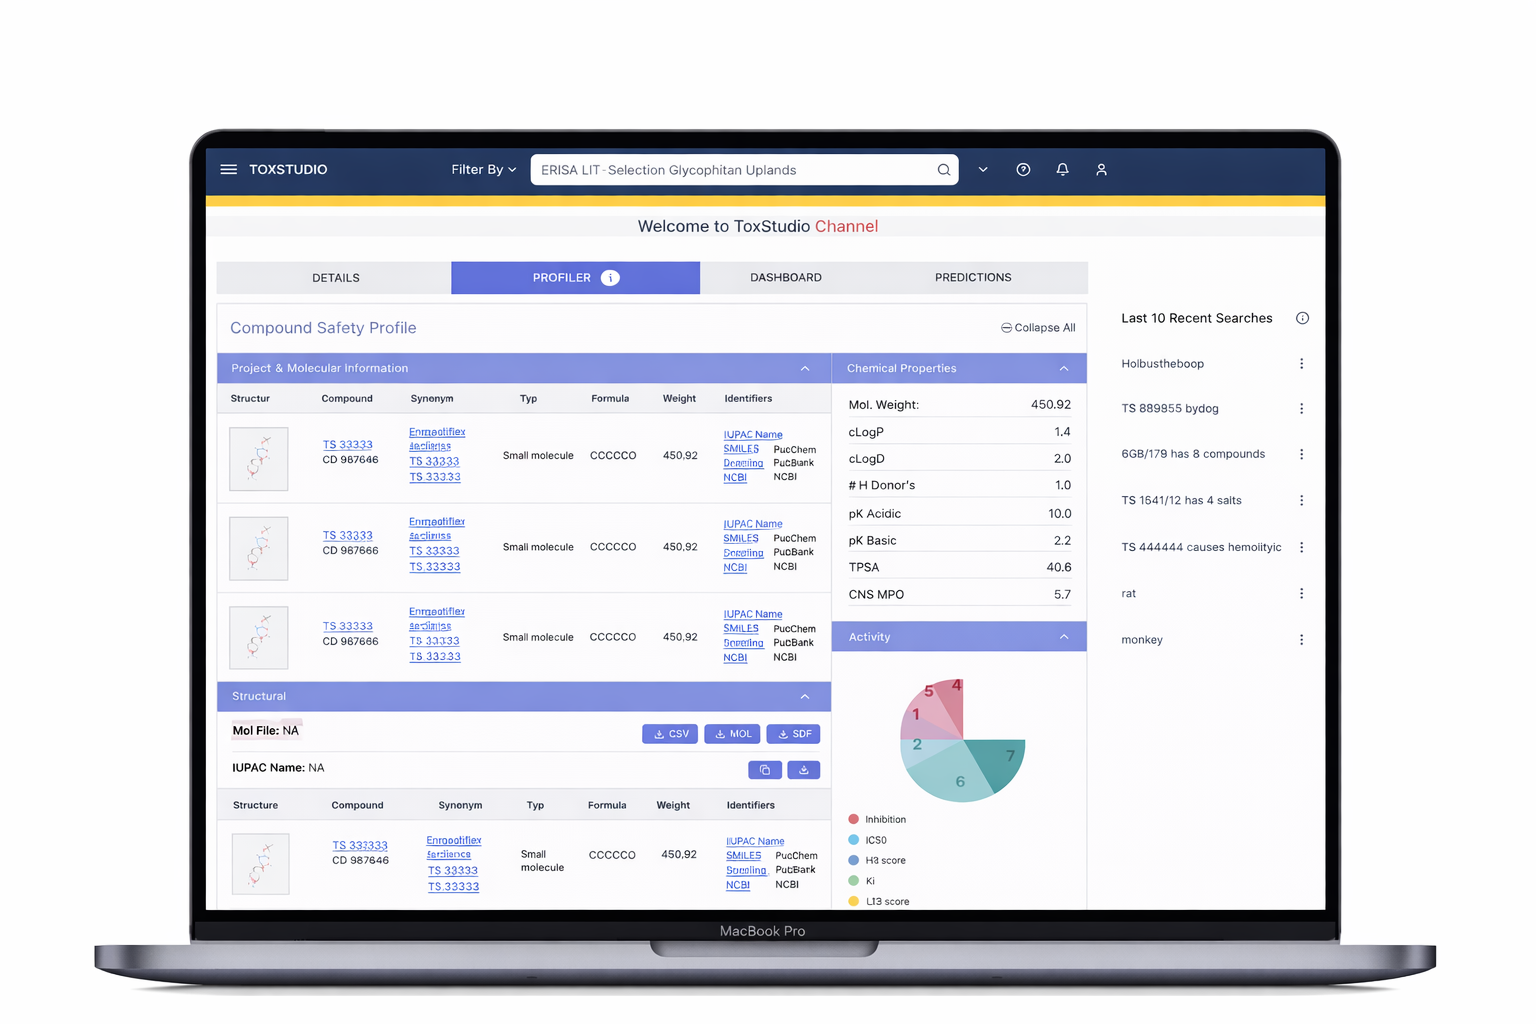
At the core of the experience is a user-driven interface, designed for flexibility, with dynamic navigation and hover-based interactions that allow users to explore complex datasets efficiently.
The system enables customized views tailored to diverse non-clinical roles, including toxicologists, pharmacologists, and research scientists.
“This reduced time to insight significantly and increased engagement with key workflows like comparison and saved intelligence.
More importantly, it shifted the platform from passive content consumption to active decision support.”
Journey Mapping
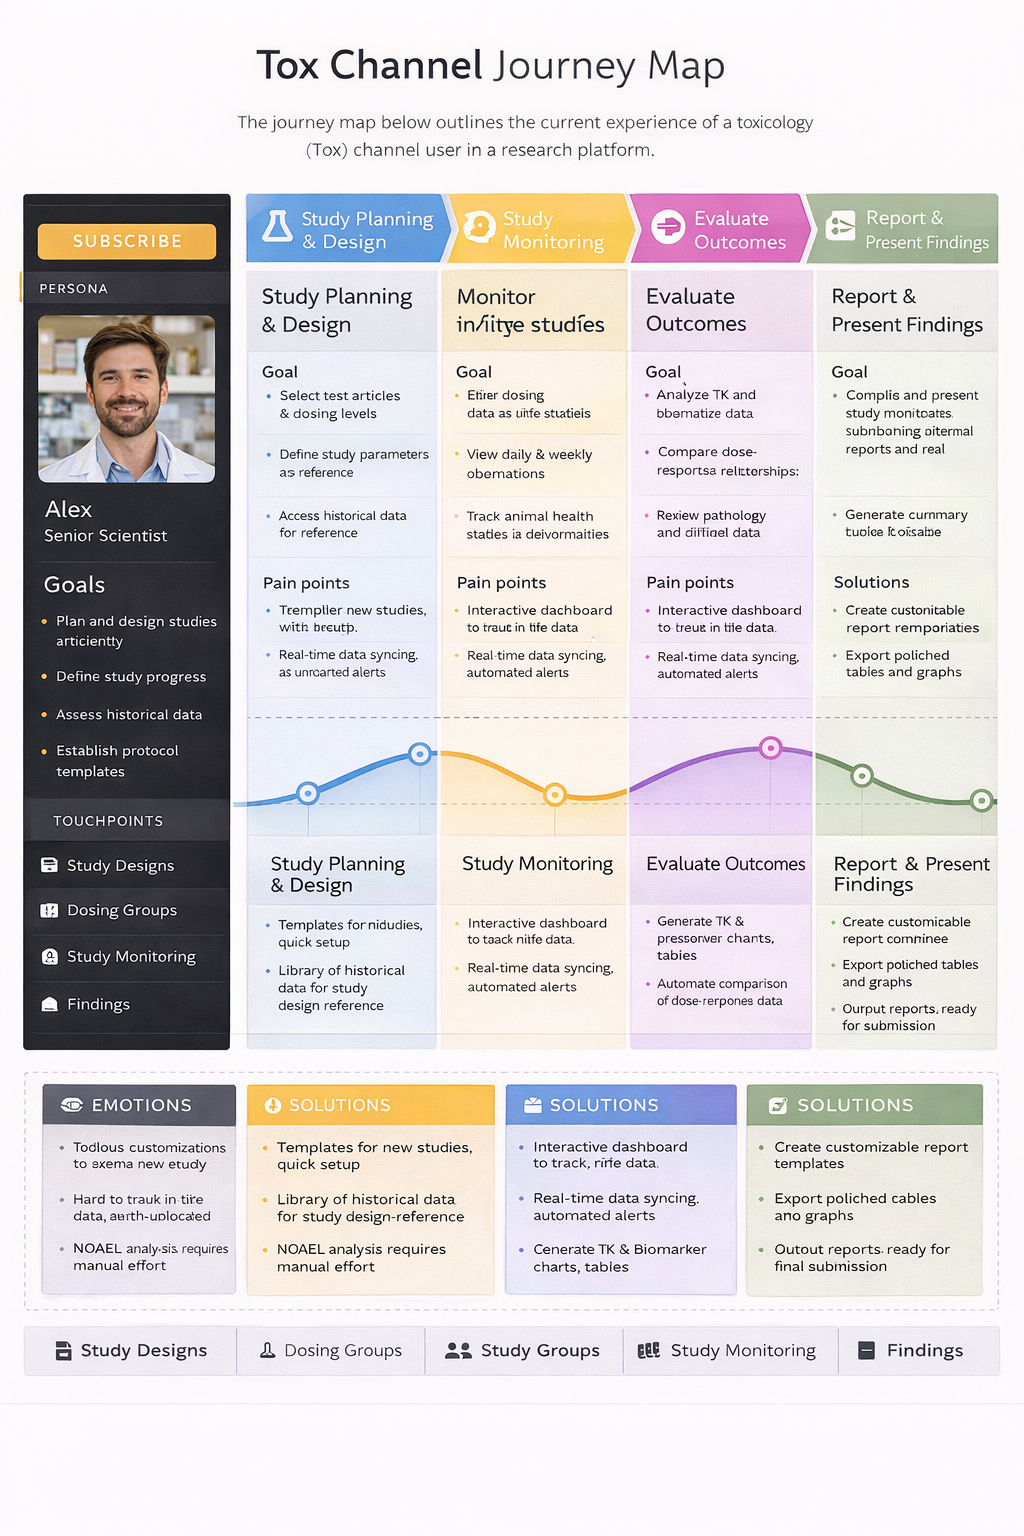
User: Corporate Risk Analyst
Context: Evaluating geopolitical risk using Stratfor Worldview
Product innovation
This work sits at the intersection of UX, data systems, and predictive modeling, focusing on designing for decision-making under uncertainty—a direction increasingly central to AI-driven products.
Evolution
“If I were to evolve this further, I’d integrate AI-driven summarization and predictive risk scoring to move even closer to real-time decision intelligence.”
Comparison
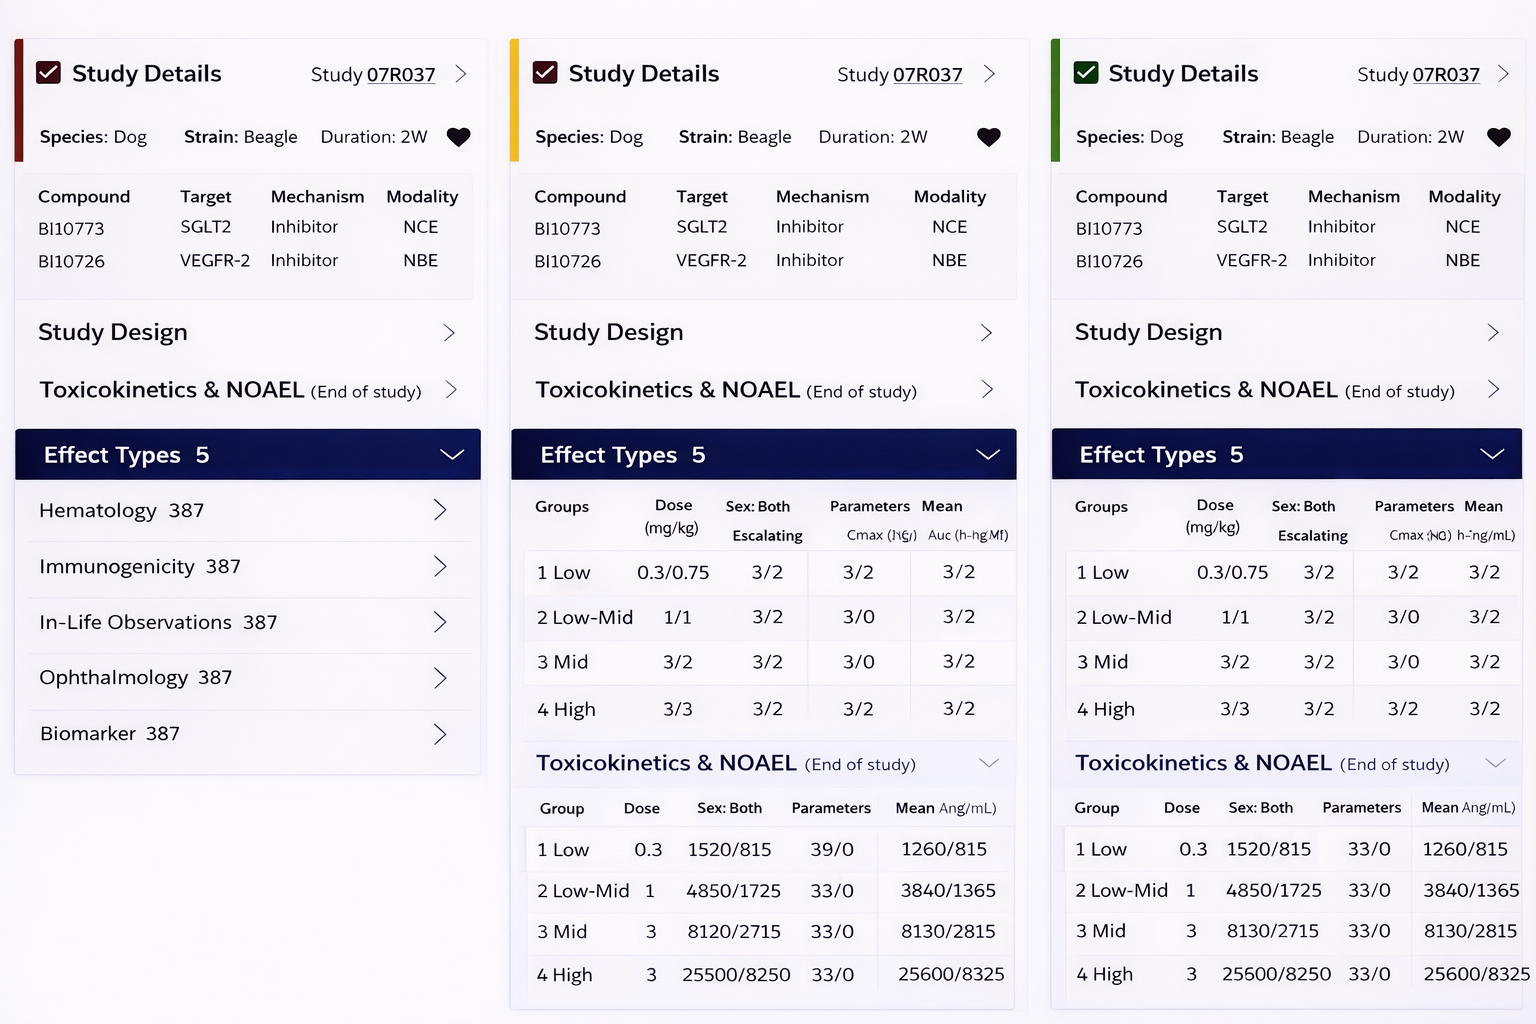
A/B Testing
Tested side-by-side comparison versus tabbed views, and heatmap versus text-based alerts, to identify the fastest path to insight.
Validation
Users completed comparison tasks faster with side-by-side views
Heatmaps significantly improved signal detection speed
Filtering reduced dataset complexity but required guided defaults
Users preferred visual summaries before deep data
Product innovation
This work sits at the intersection of UX, data systems, and predictive modeling, focusing on designing for decision-making under uncertainty—a direction increasingly central to AI-driven products.
Evolution
“If I were to evolve this further, I’d integrate AI-driven summarization and predictive risk scoring to move even closer to real-time decision intelligence.”
The platform heavily rely on comparison feature as prime factor of the evaluating research findings.

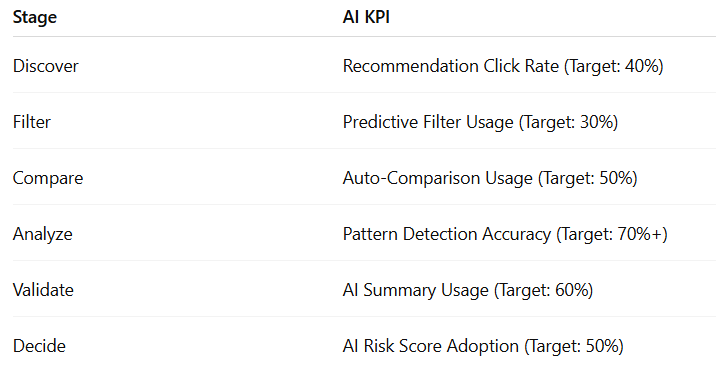
“We aligned KPIs to each stage of the user journey to ensure we weren’t just improving usability, but accelerating decision-making and generating structured data for machine learning.”
Metrics
Meta KPI’s
Time to Insight (TTI): ↓ 50%
End-to-End Task Success Rate: 90%+
User Retention (Weekly Active Users): +35%
ML-Ready Data Growth: 2–3x